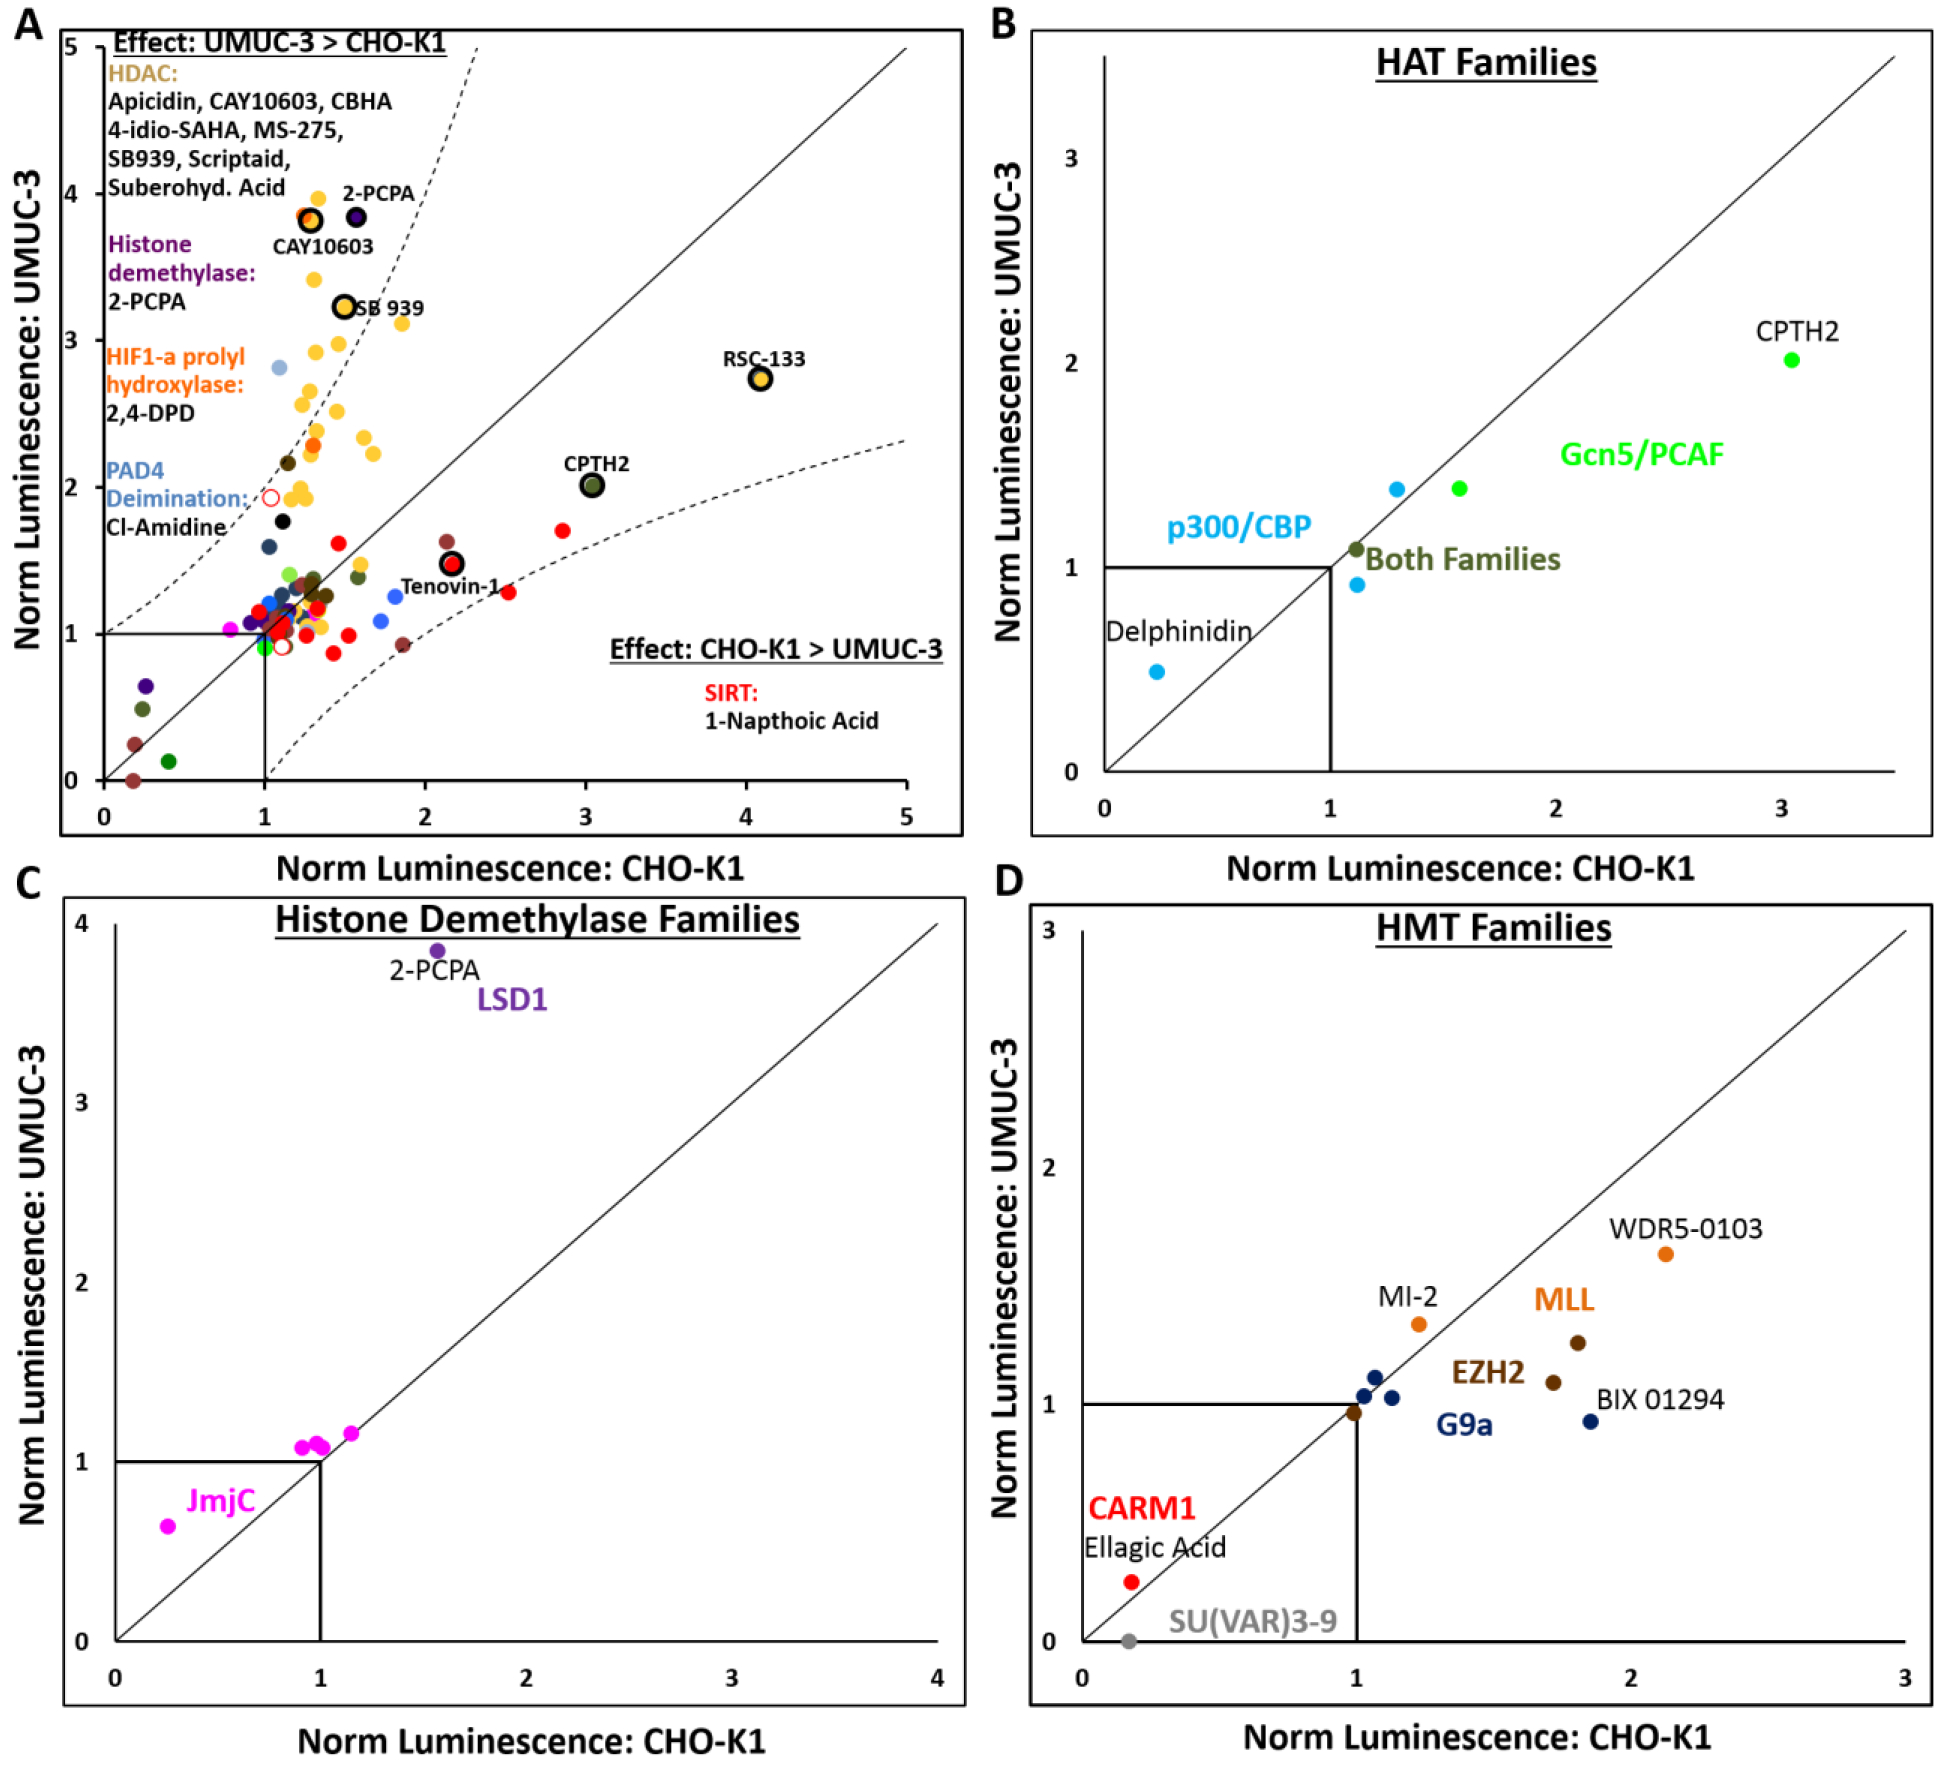
Figure 2.

Screening results depicted on a dot plot showing normalized luciferase expression in UMUC3 cells (y-axis) and CHO-K1 cells (x-axis). A) Inhibitors falling near the y=x line have similar effect on luciferase expression in both cell lines. Those that fall outside of the y=2x and x=2y lines have 2x greater effect in UMUC3 cells than CHO-K1 cells or vice versa, respectively. Such inhibitors are listed under their family type in these regions. All inhibitors are color-coded by modulator family defined in figure 1. Data points corresponding to lead inhibitors discussed later are circled in black. B) Histone acetyltransferase inhibitors, C) histone demethylase inhibitors, and D) histone methyltransferase inhibitors depicted by their sub-families.
