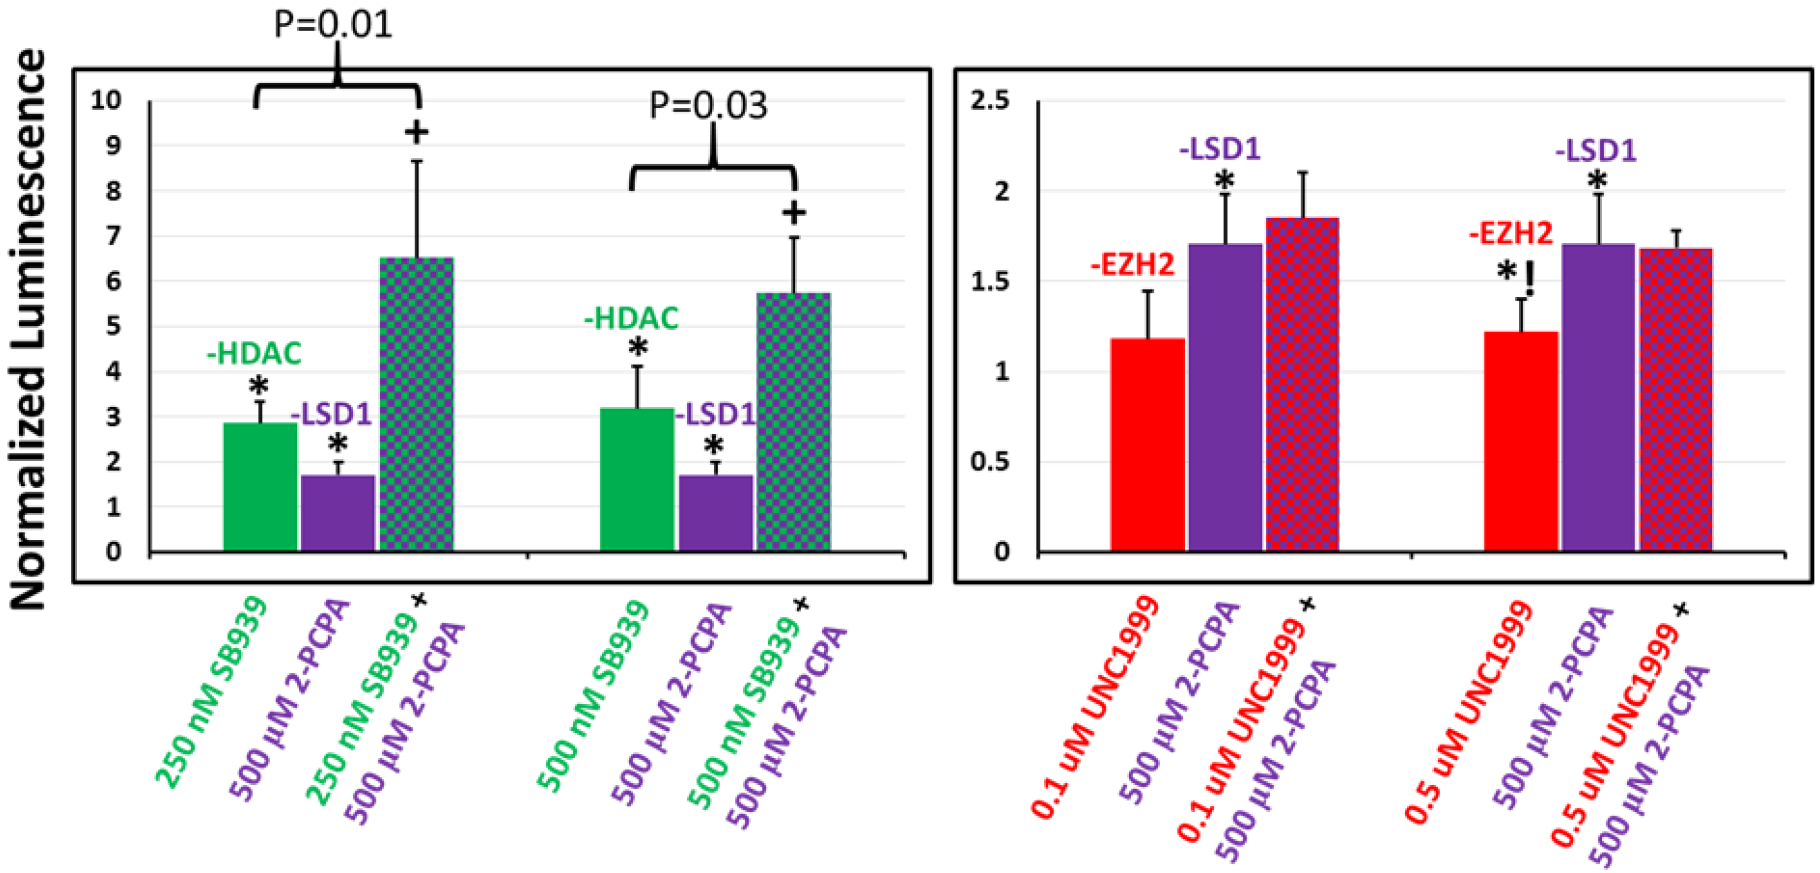
Figure 6.

Relative transgene (luciferase) expression in UMUC3 cells following single and dual combination treatments with epigenetics modulators targeting (left) HDAC and LSD1, and (right) EZH2 and LSD1; the N-RGDE polymer was used for delivering pDNA in these studies. Single-agent inhibitor treatments are indicated by solid bars and dual combination inhibitor treatments are indicated using checkered bars. Transgene expression in each case is normalized to that seen in presence of DMSO (carrier). * indicates p-value <0.05 relative to DMSO control treatment and *! indicates p-value = 0.05 relative to DMSO control treatment as determined using Student’s T-test; + indicates p-value < 0.05 relative to both individual inhibitor treatment transfections as determined using Student’s t-test. SB939, 2-PCPA hydrochloride, and UNC1999 are inhibitors of HDAC, LSD1, and EZH2 respectively. n=5 independent experiments.
