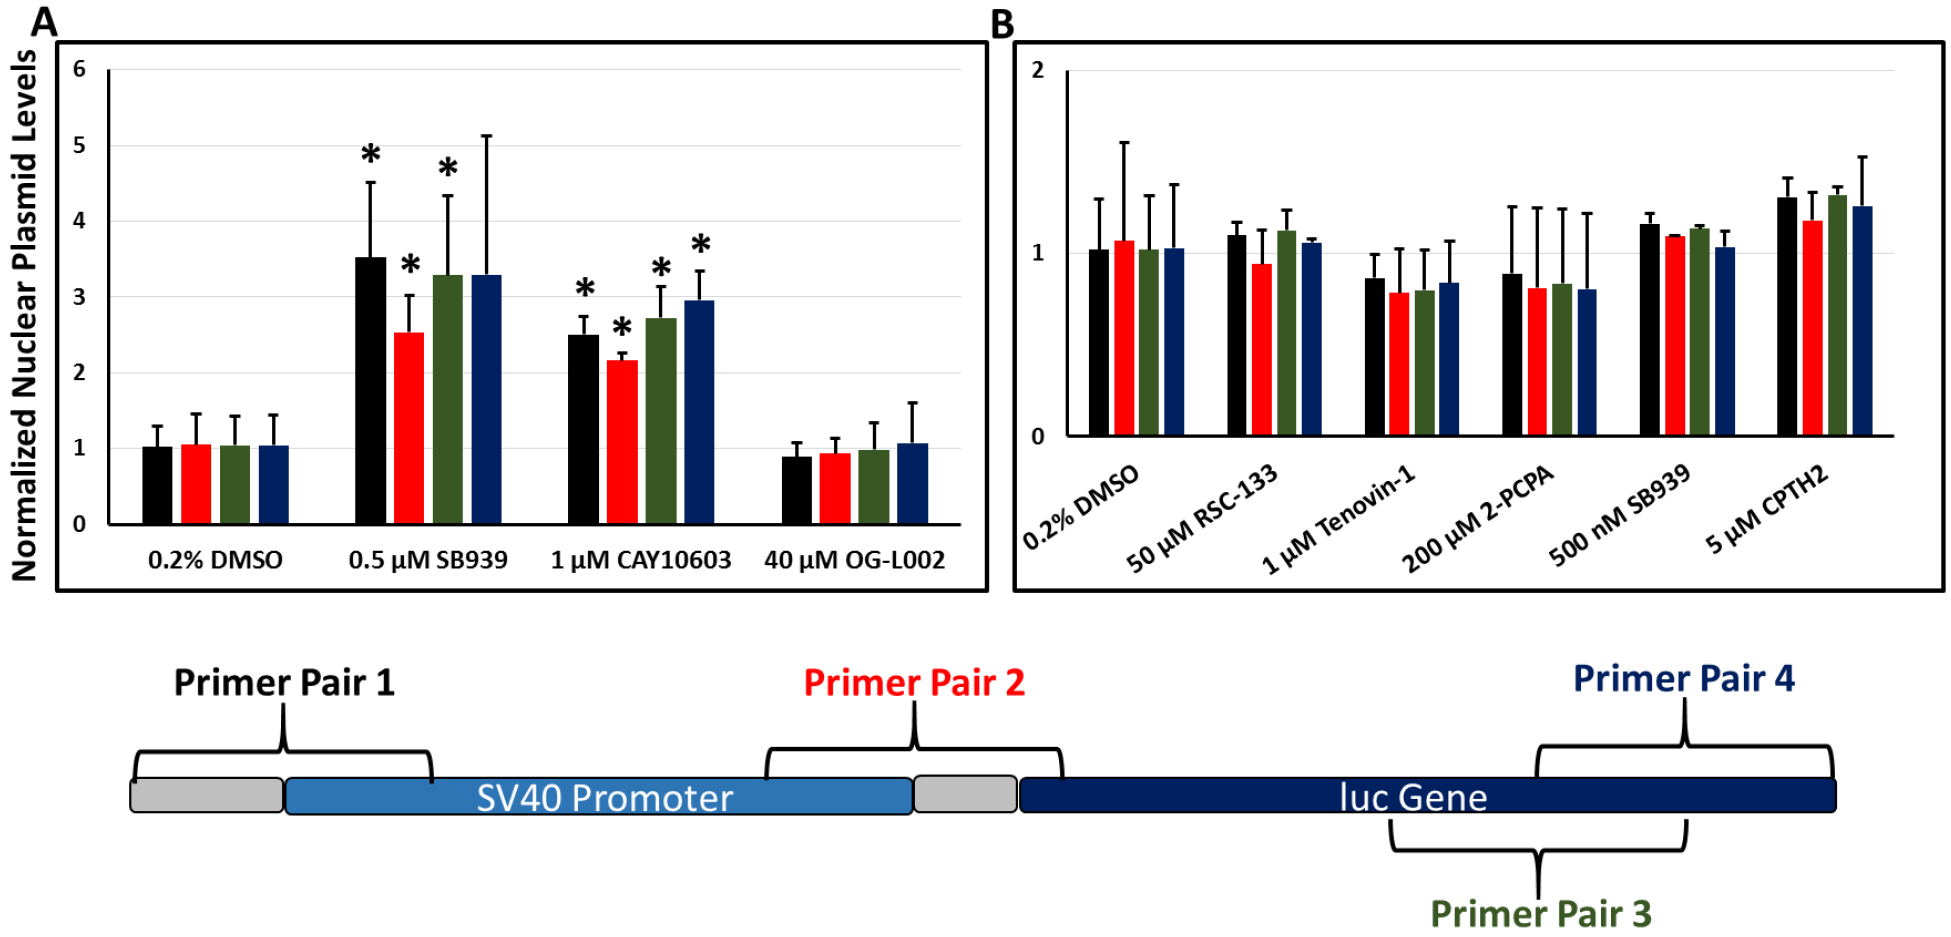
Figure 7.

Localization of the pGL3 plasmid in the nuclear fraction of (A) UMUC3 cells (n=3 independent experiments) and (B) CHO-K1 cells (n=2 independent experiments) following delivery of the plasmid along with different epigenetics modulators. The assayed region of the pGL3 plasmid is illustrated with rough primer pair locations indicated. Bars are color-coded according to their respective primer pair label color on the plasmid map. *indicates p-value < 0.05 for plasmid presence in nuclear fraction relative to vehicle control condition. (Student’s t-test).
