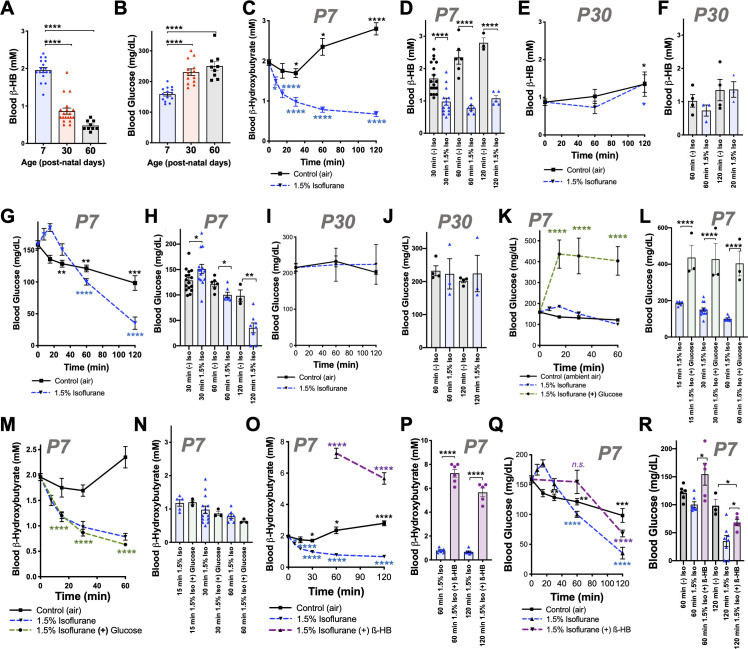
Figure 1. Isoflurane exposure disrupts circulating glucose and beta-hydroxybutyrate in neonatal mice.
(A) Blood β-hydroxybutyrate (β-HB) concentration in neonatal post-natal day 7 (P7), adolescent post-natal day 30 (P30), and young adult post-natal day 60 (P60) mice. n = 17, 19, and 9, respectively. ****p<0.0001 by pairwise t-test. ANOVA ****p<0.0001. (B) Blood glucose in P7, P30, and P60 mice. n = 14, 13, and 9, respectively. ****p<0.0001 by pairwise t-test. ANOVA ****p<0.0001. (C, D) Blood β-HB in P7 neonatal mice exposed to 1.5% isoflurane or control conditions for 0 to 120 min. (C) Pairwise comparisons shown between baseline (time = 0) and respective treatment timepoints. *p≤0.05, ****p<0.0001 by two-tailed pairwise t-test. (D) Bar graphs with individual datapoints for pairwise comparisons between treatments at 30, 60, and 120 min. ****p<0.0001 by two-tailed pairwise t-test. (E, F) Blood β-HB in P30 adolescent mice exposed to 1.5% isoflurane or control conditions for 0–120 min. (E) Control and isoflurane-exposed groups both show a modest but significant increase in β-HB over baseline by 2 hr of exposure, *p≤0.05. (F) Isoflurane exposure did not significantly alter β-HB levels relative to time-matched control conditions. (G–H) Blood β-HB in P7 neonatal mice exposed to 1.5% isoflurane or control conditions for 0–120 min. (G) Pairwise comparisons shown between baseline (time = 0) and respective treatment timepoints. *p≤0.05, **p<0.005, ***p<0.0005, ****p<0.0001 by two-tailed pairwise t-test. (H) Bar graphs with individual datapoints for pairwise comparisons between treatments at 30, 60, and 120 min. *p≤0.05, **p<0.005. (I, J) Blood glucose levels in P30 mice exposed to control conditions or 1.5% isoflurane anesthesia for up to 120 min. (I) Blood glucose levels did not significantly change compared to baseline. (J) Bar graphs of data in (I) with individual datapoints for pairwise comparison of blood glucose levels by treatment. No significant changes observed. (K, L) Blood glucose in P7 mice provided glucose by IP injection at the start of anesthetic exposure plotted as a function of time. (K) Control-exposed and 1.5% isoflurane- exposed data from (G) shown for reference. Pairwise comparisons shown between baseline (T = 0) values and 15, 30, and 60 min timepoints in 1.5% isoflurane (+) glucose treatment group, ****p<0.0001 by pairwise t-test. (L) Bar graphs of (K) with individual datapoints for pairwise comparisons of blood glucose in mice exposed to 1.5% isoflurane or 1.5% isoflurane (+) glucose. ****p<0.0001 by two-tailed pairwise t-test. (M, N) Blood β-HB levels in mice provided glucose by IP injection at the start of anesthetic exposure, plotted as a function of time. (M) Control-exposed and 1.5% isoflurane-exposed data from (C) shown for reference. Pairwise comparisons shown between baseline (T = 0) and 15, 30, and 60 min timepoints in 1.5% isoflurane (+) glucose treatment group, ****p<0.0001. (N) Bar graphs of (M) with individual datapoints for pairwise comparisons of blood β-HB in mice exposed to 1.5% isoflurane or 1.5% isoflurane (+) glucose. Glucose administration did not attenuate the loss of β-HB in response to isoflurane exposure. (O, P) Blood β-HB levels in mice provided β-HB by IP injection at the start of anesthetic exposure. (O) Control-exposed and 1.5% isoflurane-exposed data from (C) shown for reference. Pairwise comparisons shown between baseline (T = 0) and 60 and 120 min timepoints in 1.5% isoflurane (+) β-HB treatment group, ****p<0.0001. (P) Bar graphs of (O) with individual datapoints for pairwise comparisons of blood β-HB in mice exposed to 1.5% isoflurane or 1.5% isoflurane (+) glucose. ****p<0.0001. (Q, R) Blood glucose levels in mice provided β-HB by IP injection at the start of anesthetic exposure, plotted as a function of time. (Q) Control -exposed and 1.5% isoflurane-exposed data from (G) shown for reference. Pairwise comparisons shown between baseline (T = 0) and 60 and 120 min timepoints in 1.5% isoflurane (+) β-HB treatment group, ****p<0.0001, n.s. – not significant. (R) Bar graphs of (Q) with individual datapoints for pairwise comparisons of blood β-HB in mice exposed to 1.5% isoflurane or 1.5% isoflurane (+) glucose or baseline. *p<0.05. For all data, error bars represent standard error of the mean (SEM). ANOVA p-value for 1 hr dataset *p=0.0083; ANOVA for 2 hr dataset **p=0.0033. (A–R) For all data, n ≥ 3 per time/treatment. Each datapoint in bar graphs represents an individual animal. See Materials and methods for additional details.


