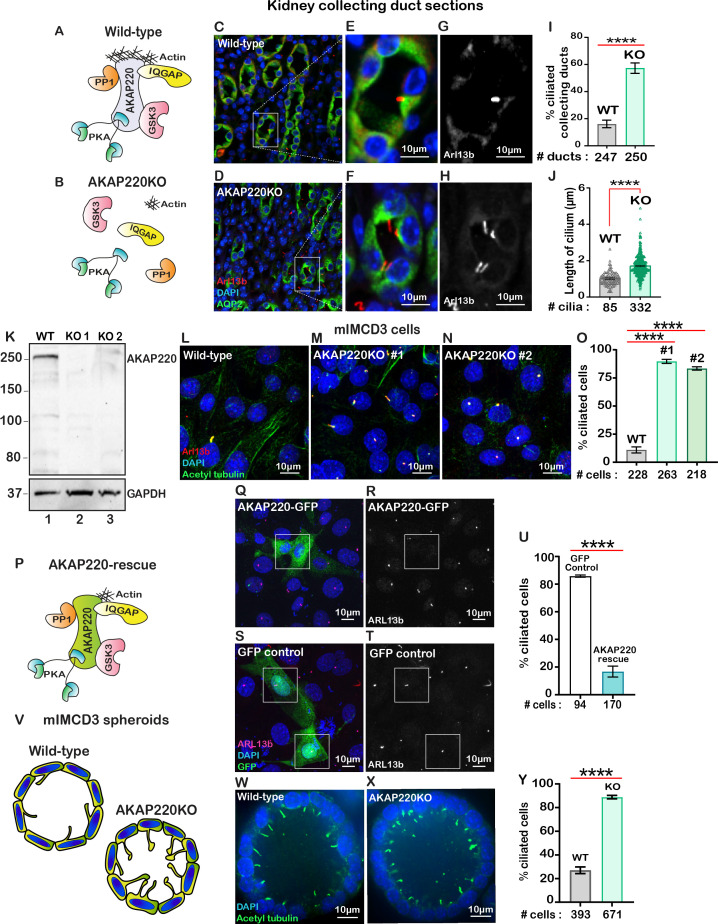
Figure 1. Loss of AKAP220 enhances ciliogenesis.
(A) Schematic of AKAP220 interaction with selected binding partners. (B) Disruption of this signaling complex upon removal of AKAP220. Protein kinase A (blue), Glycogen synthase kinase-3 (pink), Protein phosphatase 1 (orange) and IQGAP (yellow) are indicated. (C–H) Immunofluorescent staining of kidney collecting ducts with Arl13b (red), Aquaporin-2 (green) and DAPI (blue) from (C) wild-type and (D) AKAP220KO mice. (E and F) Enlarged sections from wild-type and AKAP220KO mice. (G and H) Gray scale images of Arl13b. (I) Quantification (% ciliated collecting ducts) in wild-type (gray bar) and AKAP220KO (green bar). ****p<0.0001. (J) Quantification of cilia length (µm) in wild-type (gray bar) and AKAP220KO (green bar). ****p<0.0001. Crispr-Cas9 gene editing of AKAP220 in mIMCD3 cells. (K) Immunoblot detection of AKAP220 (top) and GAPDH loading control (bottom) from wild-type (lane 1) and AKAP220KO (lane 2) cell lysates. (L–N) Immunofluorescent detection of primary cilia with acetyl tubulin (green), Arl13b (red) and DAPI (blue) in wild-type, and two independent clones of AKAP220KO mIMCD3 cells. (O) Quantification (% ciliated cells) from wild-type (gray column), AKAP220KO#1 (green column) and AKAP220KO#2 (dark green column). ****p<0.0001, N=3. (P) Schematic depicting reformation of the signaling complex upon rescue with AKAP220. Immunofluorescent detection of Arl13b (pink), GFP (green) and DAPI (blue) in (Q) pEGFP-AKAP220 or (S) GFP-control transfected AKAP220KO mIMCD3 cells. Gray scale image of Arl13b in (R) control cells and (T) AKAP220-rescued cells. (U) Quantification (% ciliated cells) in pEGFP-AKAP220 (black bar) or GFP-control cells (teal bar). ****p<0.0001, N=3. (V) Schematic of wild-type and AKAP220KO mIMCD3 spheroids. Immunofluorescent staining with acetyl tubulin (green) and DAPI (blue) in (W) wild-type and (X) AKAP220KO spheroids. (Y) Quantification (% ciliated cells) in wild-type (gray column) and AKAP220KO (green column) spheroids. ****p<0.0001, N=3. All error bars are s.e.m. p Values were calculated by unpaired two-tailed Student’s t-test. Scale bars (10 µm). Number of cells analyzed indicated below each column.


