. 2021 Jul 12;10:e67828. doi: 10.7554/eLife.67828

Figure 3. Anchored protein phosphatase one is necessary for HDAC6 activity.

(A) Schematic of AKAP220-ΔPP1. Binding partners are indicated. Gene editing deleted the principal phosphatase binding site (KVQF) on AKAP220. (B) Nucleotide sequencing reveals substitution of the KVxF motif. (C) Immunoblot detection of AKAP220 (top) and GAPDH loading control (bottom) in AKAP220KO (lane 1) and AKAP220-ΔPP1 (lane 2) mIMCD3 cell lysates. (D) Loss of PP1-targeting motif in AKAP220 negatively impacts association with HDAC6. Co-immunoprecipitation studies show that wild-type AKAP220 recruits HDAC6 (lane 1). AKAP220-ΔPP1 recruits less HDAC6 (lane 2). Immunoblot detection of AKAP220 (top), HDAC6 (mid) in cell lysates and GAPDH loading controls (bottom) reveal that equivalent levels of both proteins were present in mIMCD3 cell lysates. (E–O) Immunofluorescent detection of acetyl tubulin (green), Arl13b (red), and DAPI (blue) in (E) wild-type and (F) AKAP220-ΔPP1 cells. Gray scale images of Arl13b in (G) wild-type and (H) AKAP220-ΔPP1 cells. A single enlarged cilium (top) and corresponding three-dimensional surface plots (bottom) from (I) wild-type and (J) AKAP220-ΔPP1 cells. Gray scale images of acetylated tubulin in (K) wild-type and (L) AKAP220-ΔPP1 cells. Enlarged sections from (K and L) (top) and corresponding three-dimensional surface plots (bottom) from (M) wild-type and (N) AKAP220-ΔPP1 cells. (O) Quantification (% ciliated cells) in wild-type (gray) and AKAP220-ΔPP1 (blue). ****p<0.0001, N=3. (P) HDAC6 activity levels (A.U.) in wild-type (gray), AKAP220KO (green) and AKAP220-ΔPP1 (blue) cells as assessed by Bioline’s activity assay. **p<0.01, N=4. (Q) Chemical structure of HDAC6 inhibitor tubacin. (R-Y) Tubacin enhances ciliogenesis in the presence of native AKAP220. Wild-type mIMCD3 cells treated with (R) DMSO or (S) tubacin (2 µM) for 4 hr. Immunofluorescent staining with acetyl tubulin (green), Arl13b (red), and DAPI (blue). (T) Higher magnification gray scale image of Arl13b staining. (X) Quantification (% ciliated cells) in DMSO (white) and tubacin-treated (gray) wild-type cells. *p<0.05, ns=non-significant; N=3. (U–Y) Tubacin has no effect on AKAP220-ΔPP1 cells. (U) DMSO and (V and W) tubacin-treated AKAP220-ΔPP1 cells. (Y) Quantification (% ciliated cells) and analysis as described above in DMSO (white) and tubacin-treated (blue). (Z) Schematic of proposed tubacin mechanism of action on AKAP220-signaling complex. All error bars are s.e.m. p Values were calculated by unpaired two-tailed Student’s t-test. Scale bars (10 µm). Number of cells analyzed indicated below each column.

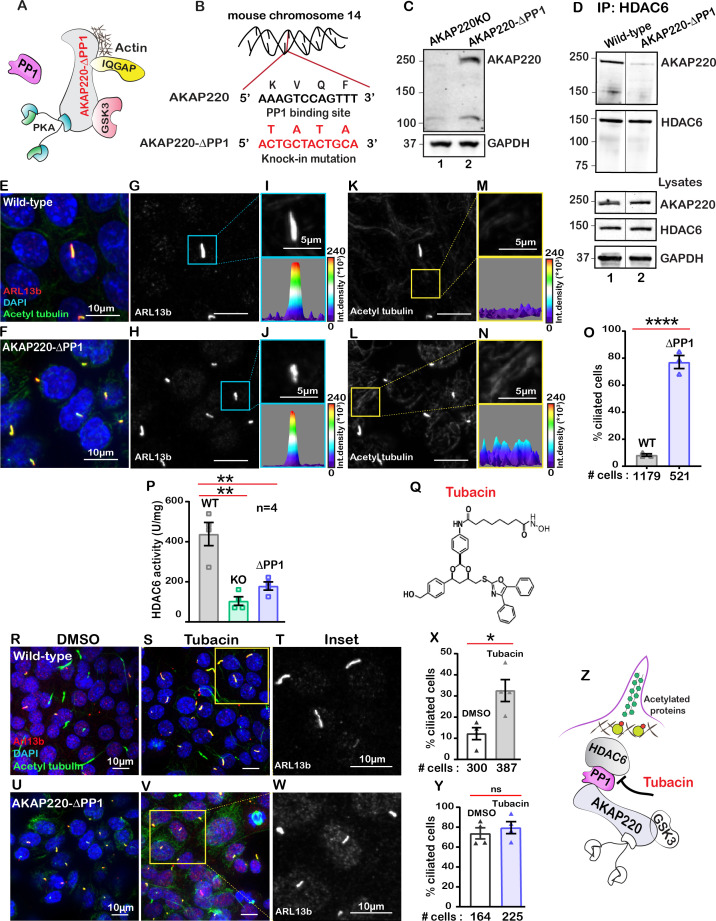
Figure 3—source data 1. Percent ciliated DMSO or tubacin-treated mIMCD3 cells.

Figure 3.

Figure 3—figure supplement 1. Characterization of AKAP220-ΔPP1 cell line.

Figure 3—figure supplement 1.

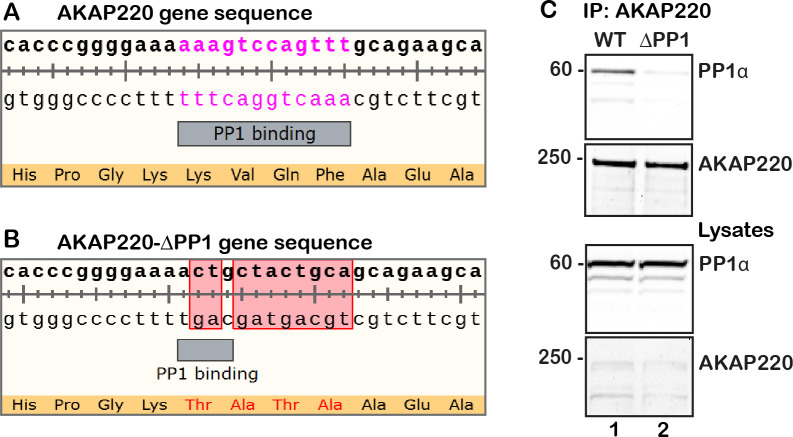
CRISPR-Cas9 gene editing was used to substitute the PP1-targeting KVQF motif in AKAP220 gene to generate AKAP220-ΔPP1 mIMCD3 cells. Sequencing analysis data shows (A) wild-type PP1-binding region in AKAP220 and (B) modified TATA region in AKAP220-ΔPP1. (C) AKAP220-ΔPP1 does not recruit PP1. Immunoblot detection shows PP1 (top panel) in WT AKAP220 immune complexes (lane 1), but not in AKAP220-ΔPP1 immune complexes (lane 2).
Figure 3—figure supplement 2. Investigating if AKAP220-HDAC6 interaction is altered in the AKAP220-ΔPP1 cells.

Figure 3—figure supplement 2.

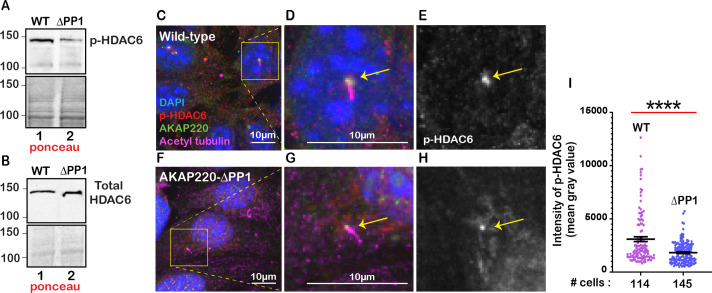
(A) Western blot of phosphorylated HDAC6 (top panel) in wild-type (lane 1) and AKAP220-ΔPP1 (lane 2) mIMCD3 cells. Ponceau blot (bottom panel) depicts equal loading. (B) Western blot of HDAC6 (top panel) in wild-type (lane 1) and AKAP220-ΔPP1 (lane 2) mIMCD3 cells. Ponceau blot (bottom panel) depicts equal loading. (C-I) Immunofluorescence images of AKAP220 (green), phospho-HDAC6(red), Acetyl tubulin (pink) and DAPI (blue) in (C) wild-type and (F) AKAP220-ΔPP1 cells. Enlarged portions depicting localization of proteins at the base of the primary cilium in (D) wild-type and (G) AKAP220-ΔPP1 cells. Gray scale images depict localization and level of p-HDAC6 in (E) wild-type and (H) AKAP220-ΔPP1 cells, respectively. (I) Quantification of p-HDAC6 intensity using ImageJ in wild-type (purple dots) and AKAP220-ΔPP1 (blue dots) mIMCD3 cells. ****p<0.0001. Number of cells analyzed are indicated below each bar.
Figure 3—figure supplement 3. Serum starvation drives mutant cells to multiciliate.

Figure 3—figure supplement 3.

(A-D) Immunofluorescent staining of Arl13b (red), acetyl tubulin (green), and DAPI (blue) in serum starved (0.5% FBS, 24 hr) (A) AKAP220-ΔPP1 mIMCD3 cells. Gray scale images of (B) Arl13b and (C) acetyl tubulin show multiple cilia in the AKAP220-ΔPP1 cell. (D) Quantification (% ciliated cells) in wild-type (purple column), AKAP220KO (green column) and AKAP220-ΔPP1 (blue column). ****p<0.0001. Number of cells analyzed are indicated below each bar.
Figure 3—figure supplement 4. Characterizing tubacin action on cilia number in AKAP220KO cells.

Figure 3—figure supplement 4.

Immunofluorescent staining with ciliary markers acetyl tubulin (green) and Arl13b (red) in (A) DMSO and (B) tubacin-treated AKAP220KO cells. DAPI (blue) serves as a nuclear marker. (C) Expanded gray scale image of Arl13b in tubacin-treated AKAP220KO cells. (D) Quantification (% ciliated cells) in DMSO (black bar) and tubacin-treated (green bar) AKAP220KO cells. The number of cells analyzed from three independent experiments are indicated below the bar for each condition. ns=non-significant. Error bars are s.e.m. p Values were calculated by unpaired two-tailed Student’s t-test. Scale bars (10 µm).