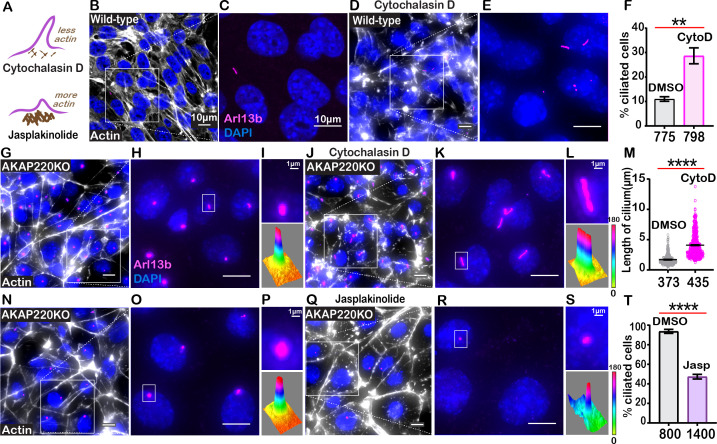
Figure 5. Cilia frequency and development involve f-actin assembly.
(A) Schematic of how actin modulating drugs impact primary cilia. Cytochalasin D depolymerizes actin barriers. Jasplakinolide stabilizes actin filaments. (B–F) Immunofluorescent detection of actin (white), Arl13b (pink), and DAPI (blue) in wild-type mIMCD3 cells treated with (B) DMSO or (D) 200 nM Cytochalasin D. Enlarged regions emphasize cilia frequency in (C) DMSO and (E) Cytochalasin D-treated cells. (F) Quantification (% ciliated cells) in DMSO (gray) and Cytochalasin D (pink) treated cells. **p<0.01, N=3. (G–M) Immunofluorescent detection of actin (white), Arl13b (pink), and DAPI (blue) in (G) DMSO and (J) Cytochalasin-D-treated AKAP220KO cells. (Inset) Expanded field of cells treated with (H) DMSO or (K) Cytochalasin D. Boxed regions in (I and L) focus on a single cilium (top) and three-dimensional surface plot (bottom). The width of the cylindrical region in the 3D surface plot represents cilium length. (M) Quantification of cilia length in DMSO (gray) and Cytochalasin D (pink) treated cells. ****p<0.0001, N=3. (N–T) Immunofluorescent staining of actin (white) and DAPI (blue) of (N) (DMSO) and (Q) (Jasplakinolide)-treated AKAP220KO cells. (Inset) Expanded field of cells treated with (O) DMSO or (R) Jasplakinolide. Boxed regions in (P and S) focus on a single cilium (top) and three-dimensional surface plot (bottom). The width of the cylindrical region in the 3D surface plot represents cilium length. (T) Quantification (% ciliated cells) in DMSO (gray) and Jasplakinolide (purple). ****p<0.0001, N=3. All error bars are s.e.m. p Values were calculated by unpaired two-tailed Student’s t-test. Scale bars (10 µm). Number of cells analyzed indicated below each column.


