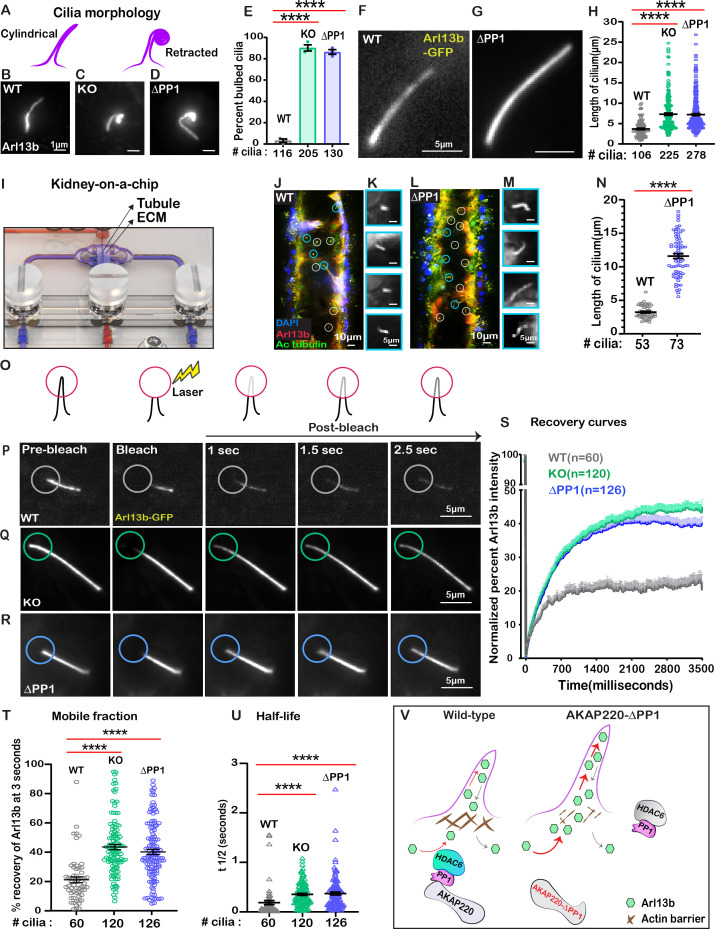
Figure 6. Loss of phosphatase anchoring promotes cilium elongation.
(A) Schematic of cylindrical and retracted cilia morphologies (purple). Super-resolution fixed-cell imaging of Arl13b (gray scale) in (B) wild-type, (C) AKAP220KO, and (D) AKAP220-ΔPP1 cilia. (E) Quantification (% bulbed cilia) in wild-type (gray), AKAP220KO (green), and AKAP220-ΔPP1 (blue) cells. ****p<0.0001, N=3. Scale bars (1 µm). Super-resolution live-cell images of Arl13b-GFP in (F) wild-type and (G) AKAP220-ΔPP1 cilia. (H) Quantification of cilia length in wild-type (gray), AKAP220KO (green), and AKAP220-ΔPP1 (blue) cells. ****p<0.0001, N=3. Scale bars (5 µm). (I) Kidney-on-a-chip device. Location of kidney tubule (Tubule) and extracellular matrix (ECM) are indicated. Confocal imaging of (J) Wild-type and (L) AKAP220-ΔPP1cells cultured in chip device with Arl13b (red), acetyl tubulin (green), and DAPI (blue). Cilia (white circles) are marked. (Insets) Magnified images of representative cilia (cyan circles) from (K) wild-type and (M) AKAP220-ΔPP1 pseudotubules. (N) Quantification of cilia length in wild-type (gray) and AKAP220-ΔPP1 (blue). ****p<0.0001, N=3. Scale bars (10 µm). Inset scale bars (5 µm). (O–U) Fluorescence recovery after photobleaching (FRAP) of Arl13b-GFP in primary cilia. (O) Schematic of how FRAP was measured. (P–R) Super-resolution live-cell images of Arl13b-GFP in (P) wild-type, (Q) AKAP220KO and (R) AKAP220-ΔPP1 cells. Circles mark bleached portion of cilia. (S) FRAP recovery curves of Arl13b over time (3500 ms) in wild-type (gray), AKAP220KO (green), and AKAP220-ΔPP1 (blue) cells. Scale bars (5 µm). (T) Quantification of mobile fraction in wild-type (gray), AKAP220KO (green), and AKAP220-ΔPP1 (blue) cilia. ****p<0.0001, N=3. (U) Half-life of Arl13b in wild-type (gray), AKAP220KO (green), and AKAP220-ΔPP1 (blue) cilia. ****p<0.0001, N=3. (V) Schematic depicting how AKAP220 modulation of the actin barrier influences movement of proteins in and out of primary cilia. All error bars are s.e.m. p Values were calculated by unpaired two-tailed Student’s t-test. Number of cilia analyzed indicated below each column.


