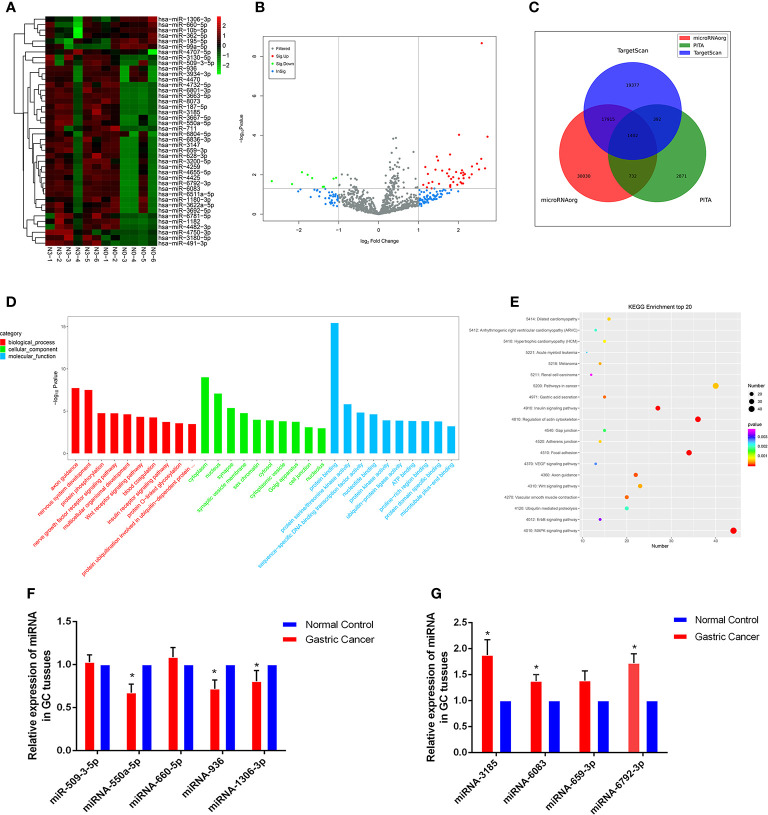
Figure 1.
Profiling of miRNAs in the tissues from GC patients with N0 and N3 group and the expressions of miRNAs GC tissues. (A) Heat map shows the upregulated and down-regulated miRNAs in N0 vs N3 group. (N0 for no lymph node metastasis, and N3 for at least 7 lymph node metastasis). Each column represents the expression profile of a tissue sample, and each row corresponds to a miRNA. High expression level is indicated by “red” and lower levels by “blue”. (B) Volcano plot shows tp-regulated and down-regulated circRNAs in cancer vs normal group. Higher expression levels are indicated by “red”, lower expression levels are indicated by “green”, and no significant difference is indicated by other colors. (C) TargetScan, PITA, microRNAorg database for target gene prediction of differential miRNAs. (D) GO analysis of miRNAs in N0 vs N3 group. (E) KEGG analysis of miRNAs in N0 vs N3 group. (F, G) Expression of nine miRNAs in GC tissues compared to normal controls. *P < 0.05.

