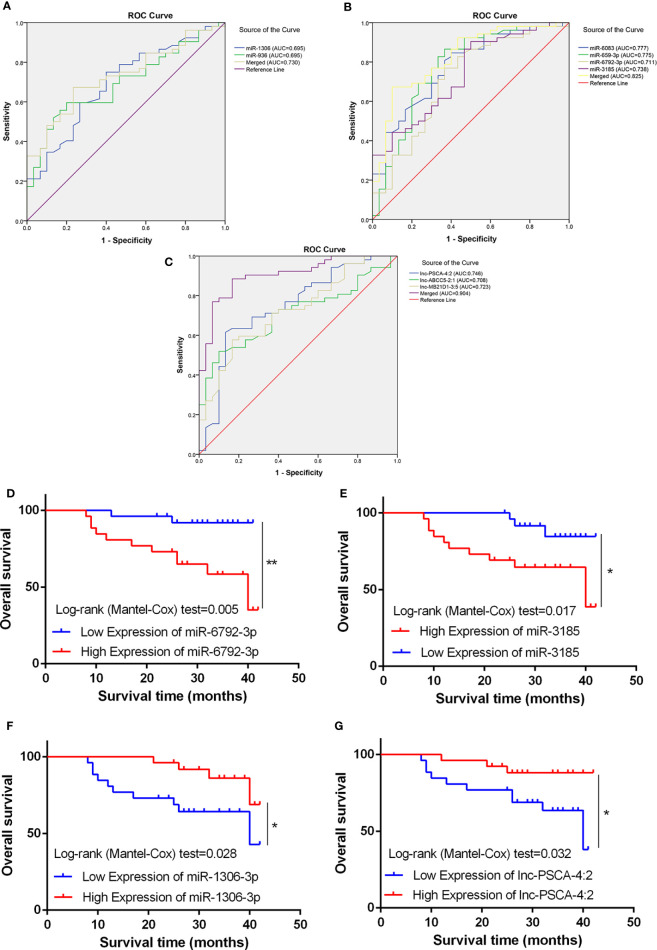
Figure 5.
Diagnostic potential of miRNA and lncRNA. (A) The area under the ROC curve (AUC) value of miRNA-936 and miRNA-1306-3p was 0.675 and 0.658 respectively. (B) The AUC value of miRNA-3185, miRNA-6083, miRNA-659-3p and miRNA-6792-3p was 0.775, 0.739, 0.777 and 0.711 respectively. (C) The AUC value of lnc-PSCA-4:2, lnc-ABCC5-2:1 and lnc-MB21D1-3:5 was 0.746, 0.708, and 0.723 respectively. (D, E) Kaplan-Meier overall survival curve revealed patients with higher miR-6792-3p and miR-3185 expression showed a reduced survival time. (F, G) Kaplan-Meier overall survival curve revealed patients with lower miR-1306-3p and lnc-PSCA-4:2 expression showed a reduced survival time. *p < 0.05, **p < 0.01.

