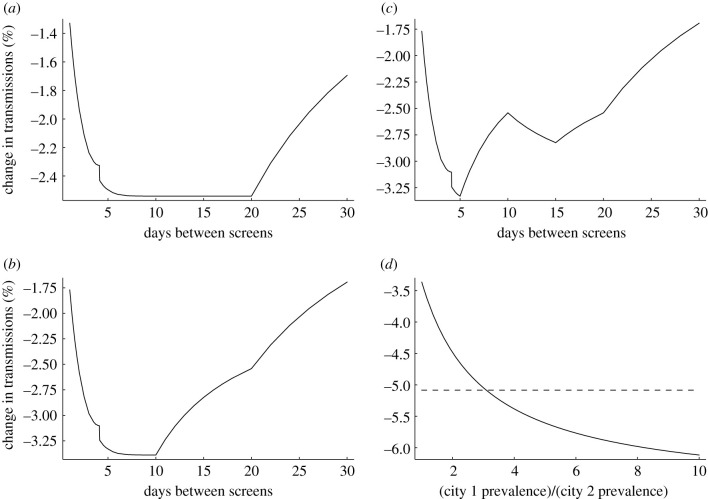
Figure 4.
Screening in more complex scenarios. (a) Scenario where testing capacity is sufficient to offer screening to the whole population every 20 days (taking non-attendance into account), and offering of tests is managed so as not to exceed capacity (a smaller proportion of the population is screened if testing is offered more frequently than every 20 days). The proportion/frequency combination does not affect testing impact, except at the extremes where tests are not all used on potentially infected individuals (right-hand side of plot: testing frequency is so low that some tests are unused; left-hand side of plot: testing frequency is so high that some people offered tests have already tested positive and isolated in a preceding testing round). Note that the very small discontinuity of approximately 0.1% near the 4-day interval in this and subsequent panels is a numerical artefact arising from the code implementation of the calculation; there is no reason to expect such a discontinuity in a real-world setting. (b) As (a) but with the population structured: half the population has twice the risk of being infected as the other half of the population. The higher risk portion of the population is prioritized for screening, with leftover tests at the chosen screening rate offered to the lower risk portion. In this scenario, the greatest reduction in transmissions occurs when all tests are offered to the high risk portion. (c) As (b) but half of each portion of the population are healthcare workers in contact with vulnerable patients, so are always screened before others, i.e. the screening priority is higher rate healthcare workers, lower rate healthcare workers, higher rate others, lower rate others. Screening all those in contact with the vulnerable more often (10 day screening interval) is possible at a cost of reduced efficacy of screening in the overall population. (d) Scenario in which there are two identical cities with two identical laboratories (realistic testing scenario), save that the first city has an infection prevalence greater than the second city. Laboratory capacity is sufficient to offer screening to everybody every 10 days. Each city’s laboratory can be used separately to offer screening to its local population (dashed line). Alternatively, both laboratories can be used to screen every 5 days those in the city with higher infection prevalence, but with an additional two-day turnaround delay for samples sent between cities (solid line). The more effective strategy depends upon relative infection rates in the two cities.

