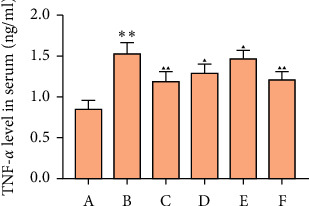
Figure 11.

Effects of MSHC on serum TNF-α in rats (A: blank control group; B: model group; C: MSHC high-dose group; D: MSHC medium-dose group; E: MSHC low-dose group; F: metformin group; compared with the blank group, ∗∗P < 0.01; compared with the model group, ▲P < 0.05, ▲▲P < 0.01).
