
Figure 1.
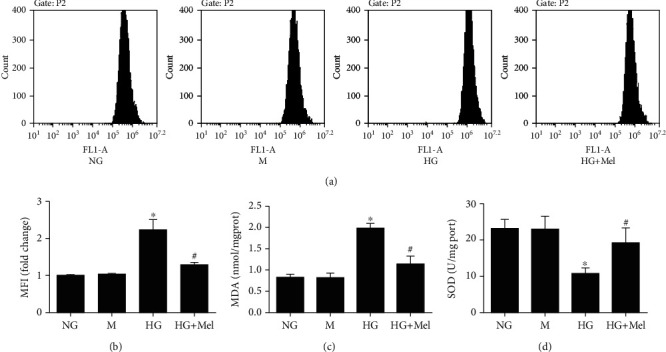
Melatonin prevented oxidant stress induced by HG in CMECs. (a) Flow cytometry to detect ROS production. (b) ROS mean fluorescent intensity. (c) MDA concentrations. (d) SOD activity. Data were expressed as the means ± SD (n = 3). ∗p < 0.05 vs. NG and #p < 0.05 vs. HG. NG: normal glucose; HG: high glucose; M: mannitol; Mel: melatonin.