
Figure 8.
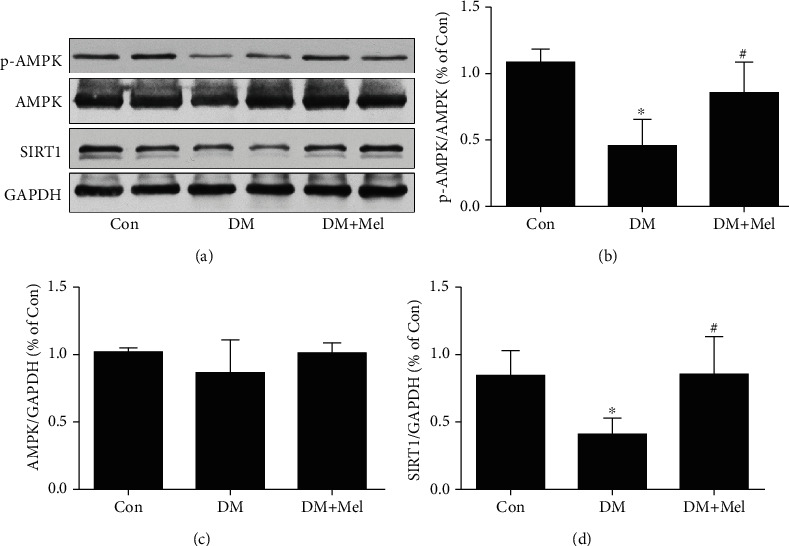
The melatonin-activated AMPK/SIRT1 signaling pathway in myocardial tissues of diabetic mice. (a) p-AMPK Thr172, AMPK, and SIRT1 expressions were analyzed with western blot. (b–d) Quantitative analysis of p-AMPK Thr172, AMPK, and SIRT1 expressions. Data were expressed as the means ± SD (n = 3‐8).∗p < 0.05 vs. Con and #p < 0.05 vs. DM. Con: control; DM: diabetes mellitus; Mel: melatonin.