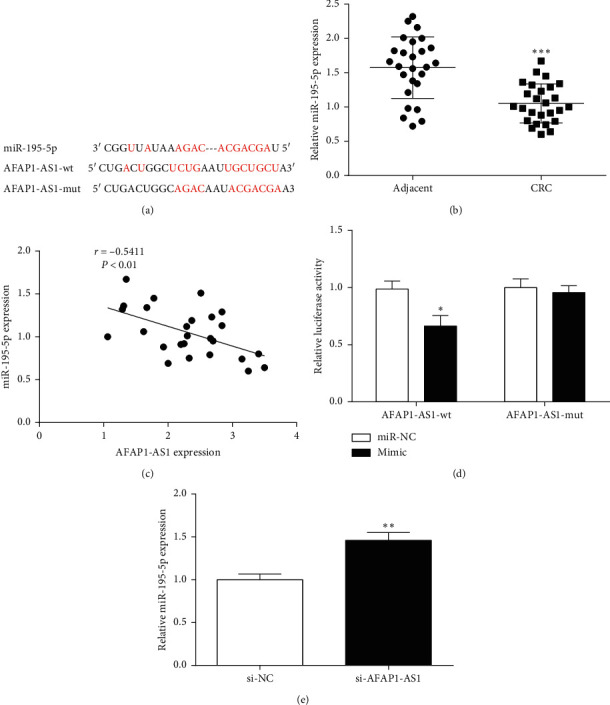
Figure 3.

The relationship between AFAP1-AS1 and miR-195-5p. (a) Binding sites between AFAP1-AS1 and miR-195-5p were predicted by bioinformatics software. (b) The expression of miR-195-5p was decreased in CRC tissues. (c) Pearson correlation analysis revealed that a negative association existed between miR-195-5p and AFAP1-AS1 expression in CRC tissues. (d) Luciferase activity assay was performed to determine the relationship between AFAP1-AS1 and miR-195-5p. (e) The changes of miR-195-5p expression in CRC cells after AFAP1-AS1 knockdown. ∗P < 0.05, ∗∗P < 0.01, and ∗∗∗P < 0.001, compared with the adjacent, miR-NC, or si-NC group.
