
Figure 6.
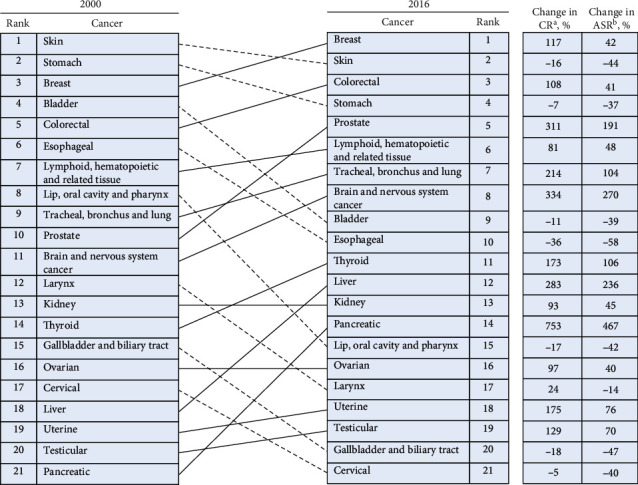
Cancers ranked for both sexes by national crude rate, including the percentage change in crude rate and the percentage change in the age-standardized rate between 2000 and 2016. The “other cancer” group is not included here because it contains multiple different types of cancers. Solid lines connecting the 2000 and 2016 charts indicate increased or unchanged rank for the connected cancers; dotted lines indicated decreased rank. aCR: crude rate; bASR, age-standardized rate.