
Figure 1.
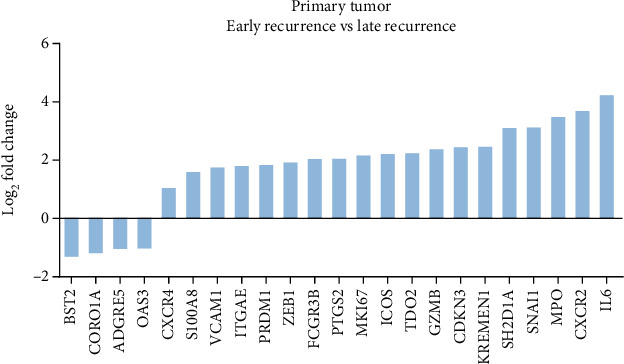
Immune oncology RNA profiling of primary lung adenocarcinoma. Waterfall plot of 23 differentially expressed genes (DEGs) between ER and LR subgroups in primary tumor. The genes were defined significantly expressed if the absolute fold change was ≥2 and the p value was <0.05.