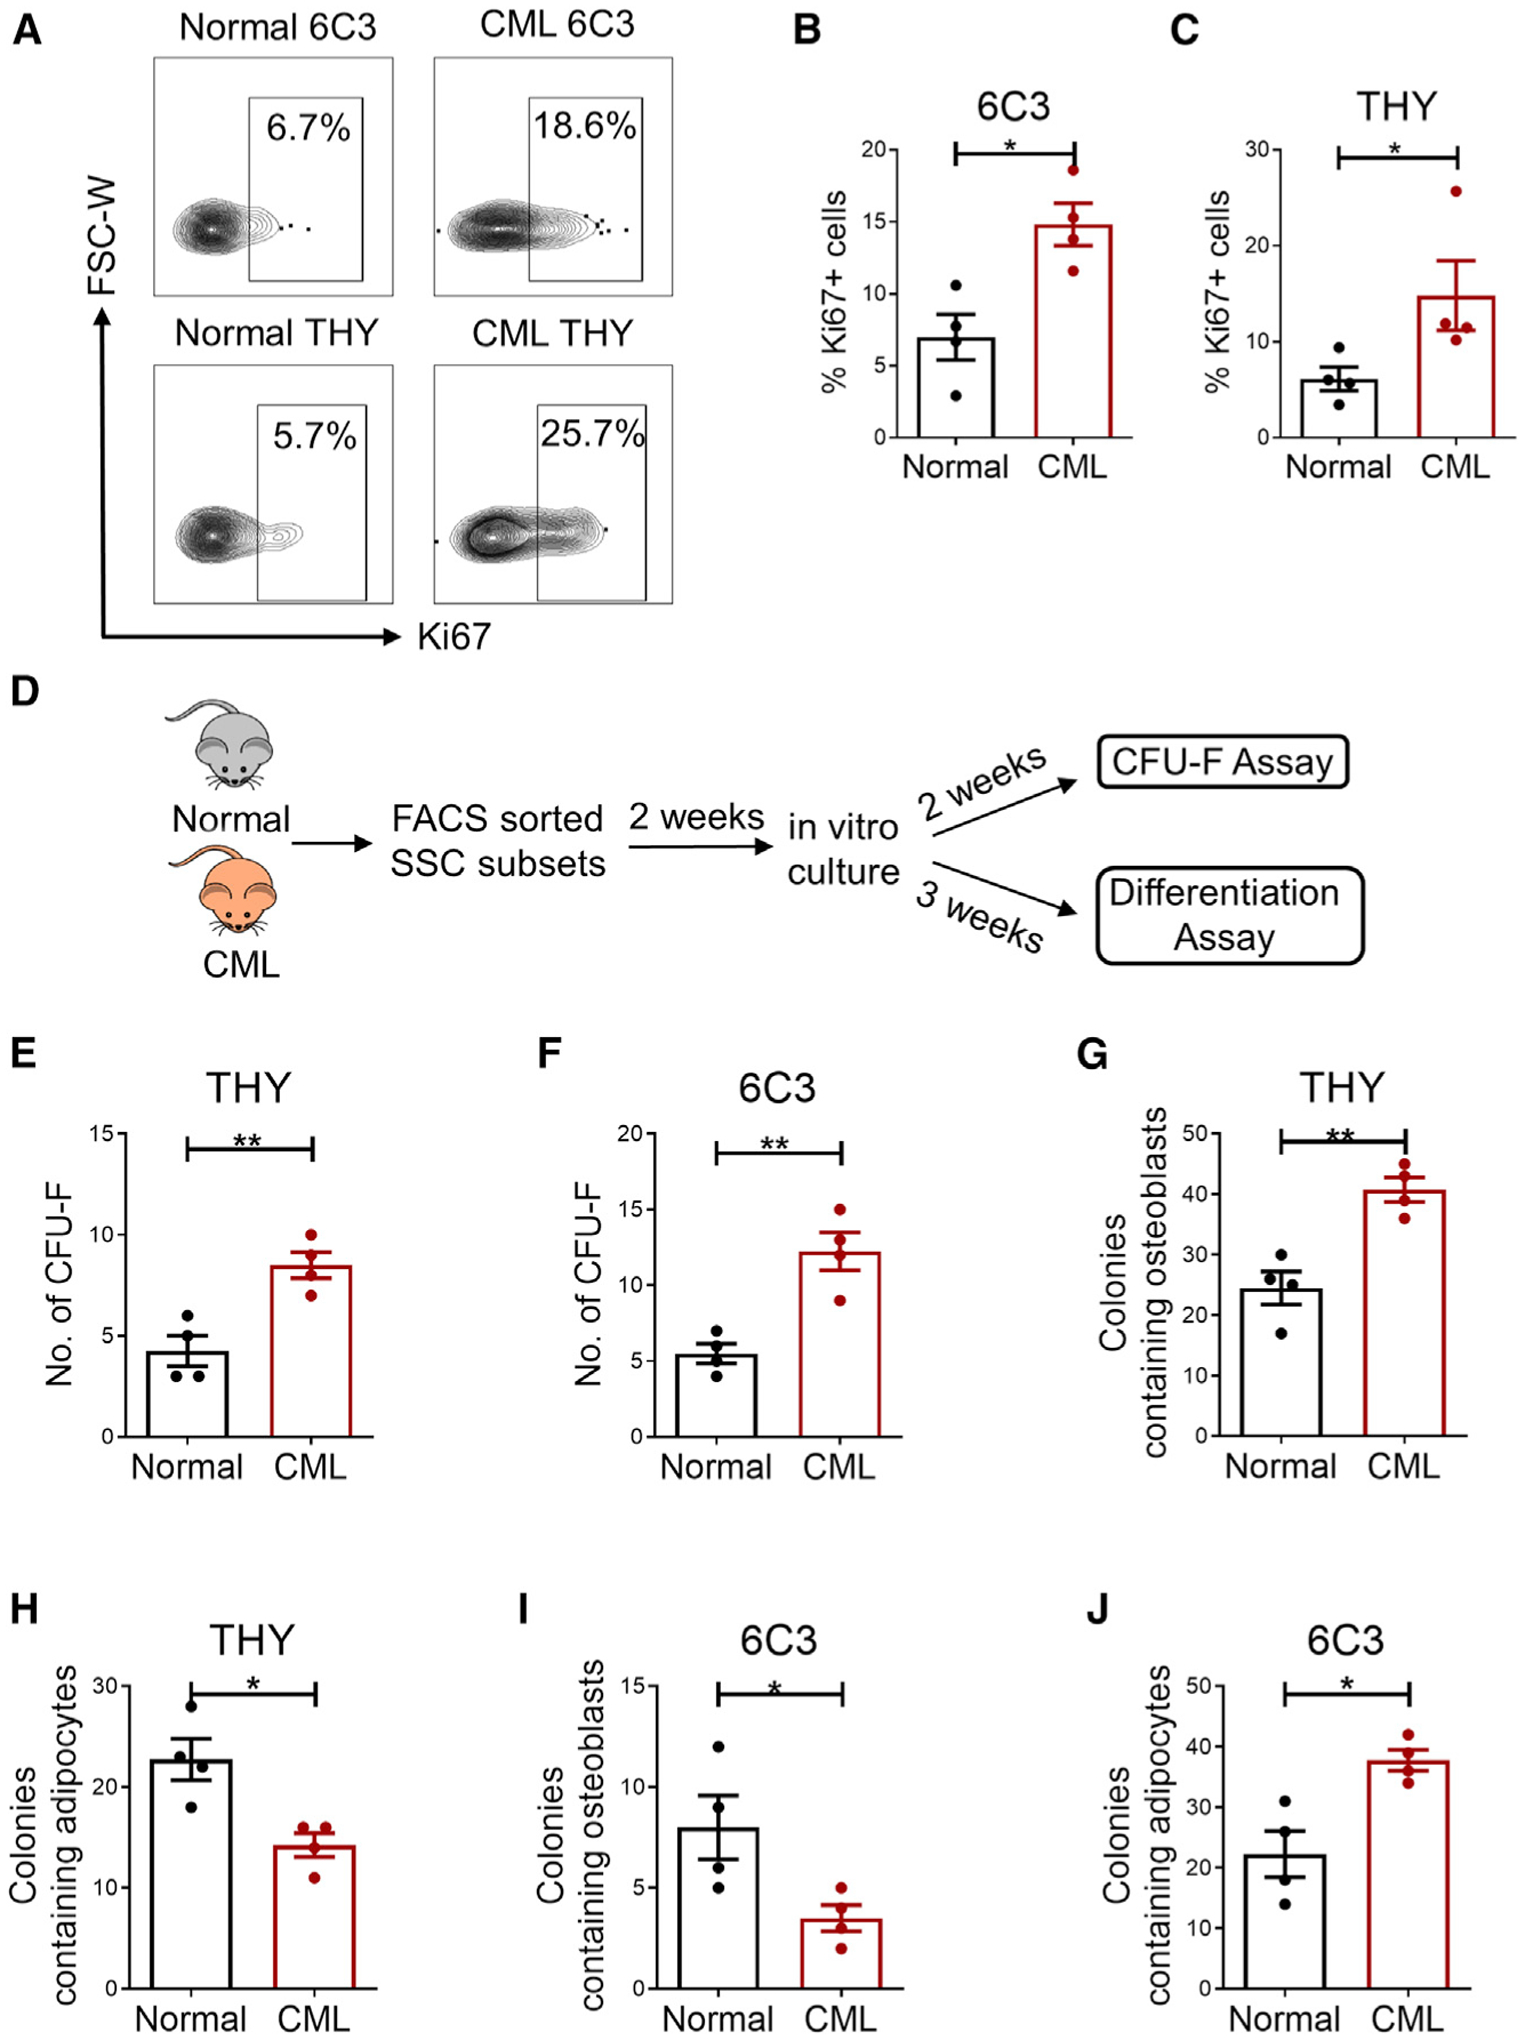
Figure 2. Altered cycling and differentiation of CML 6C3+ and THY+ progenitors.

(A) Representative flow cytometry results of freshly isolated normal and CML subsets analyzed for Ki-67 staining.
(B and C) Frequency of Ki-67+ cells in normal and CML THY+ (B) and 6C3+ populations (C) (n = 4 replicates/group). Percentages are of parent cells.
(D) Experimental schema. FACS-sorted BM subsets from primary CML and aged-matched normal mice were cultured in vitro and analyzed for CFU-F and differentiation potential.
(E and F) CFU-F numbers generated from normal and CML THY+ (E) and 6C3+ cells (F) (n = 4 replicates/group).
(G and H) Osteoblast-containing (G) and adipocyte-containing (H) colonies from THY+ cells using alizarin red staining and oil red O staining, respectively.
(I and J) Osteoblast-containing (I) and adipocyte-containing (J) colonies from 6C3+ cells using alizarin red staining and oil red O staining, respectively.
n = 4 independent experiments. Error bars represent mean ± SEM. *p < 0.05, **p < 0.01, ***p < 0.001, ****p < 0.0001.
