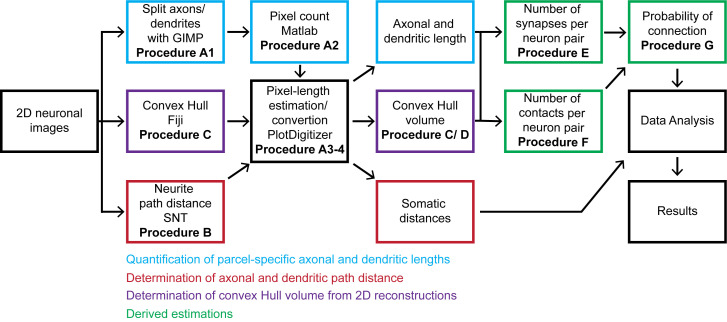
Figure 1. Flow chart of the described pipeline.
The procedure starts from 2D neuronal images that are processed to quantitate axonal and dendritic lengths, path distances from the soma by parcel, and convex hull volumes. From these quantitations, we calculate the number of synapses and contacts per neuronal pair and subsequently estimate the probabilities of connection from multiple neuronal pairs. The generated information is analyzed and presented as the mean and standard deviation.

