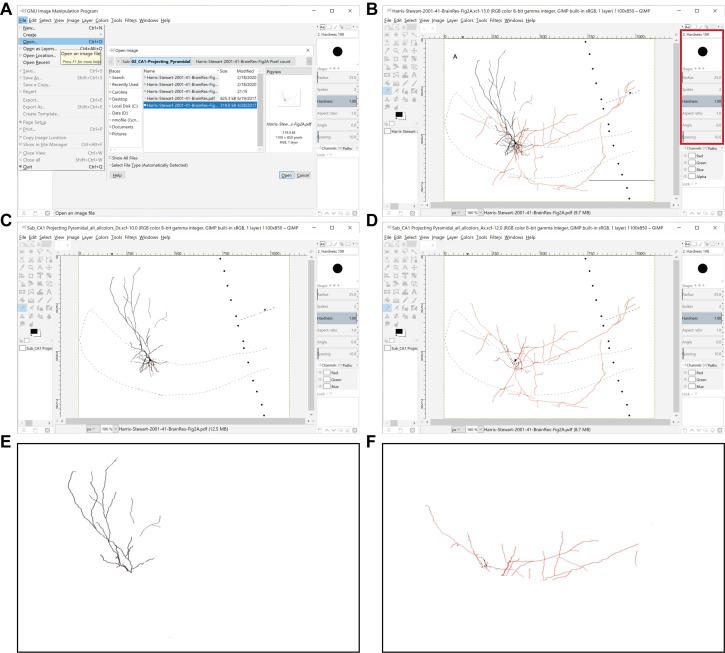
Figure 2. Preprocessing of images for the quantitation of axonal and dendritic lengths. A.
The GIMP File menu is used to open an image file to be processed. B. Representative image is in preparation for processing ( Harris et al., 2001 ), where the red box delimits the toolbox location and the circle represents the eraser tool. C, D. Shown are processed images containing only dendrites (C) or axons (D) in all the layers of the region of interest (in this example, the subiculum), which were obtained from the original image shown in (B). E, F. Shown are representative images displaying only dendrites (E) or axons (F) in the parcel of interest (in this case, the stratum moleculare of the subiculum), which were obtained from the original image shown in (B).

