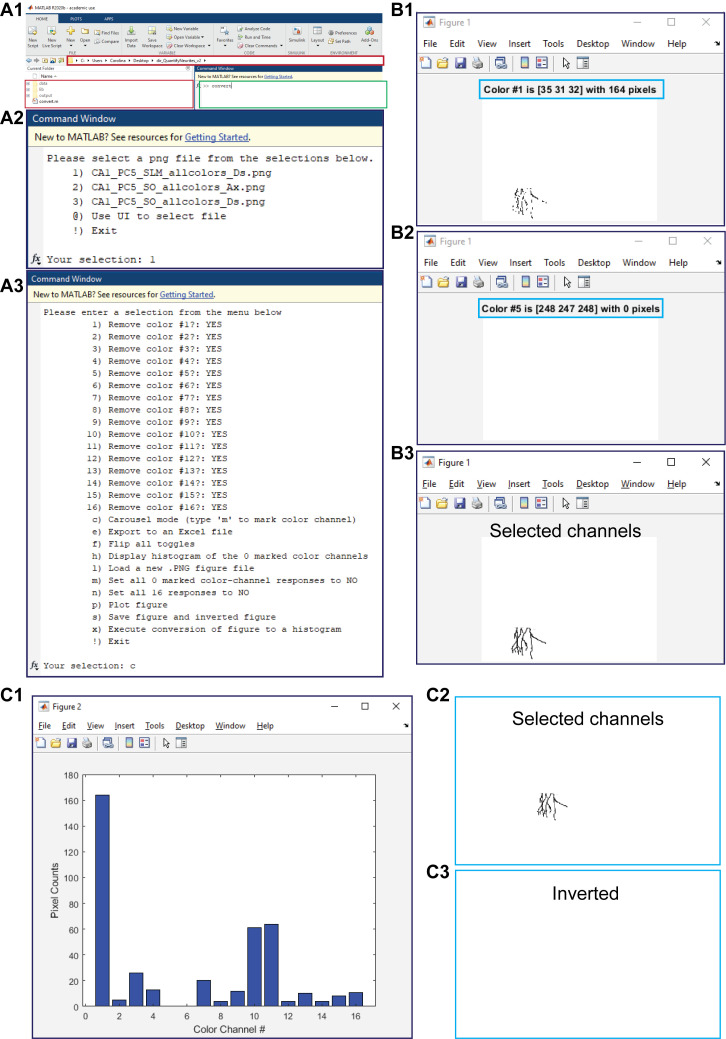
Figure 3. Pixel counting. A1.
Shown is a MATLAB window with the open working folder “dir_QuantifyNeurites_v2” in a red box and the command window to run the command “convert” in a green box. A2. The displayed menu that appears after running the command “convert” to select the image to process. A3. The displayed menu options that appear in order to analyze the selected figure. B. Shown is a representative carousel mode, where the color number and the number of pixels present (B1) or absent (B2) are delimited within the blue boxes and where a final plot figure contains only the channels selected during the full run of the carousel mode. C. Presented are a histogram of the selected channels and the number of pixels per channel (C1) and the generated PNG files for the selected (C2) and unselected (C3) channels.

