Skin index-sorted single-cell RNA sequencing reveals the transcriptional landscape of macrophages and dendritic cells in atopic and psoriatic skin and identifies CD14+ type 3 dendritic cells co-producing IL1B and IL23A in psoriatic skin.
Abstract
Inflammatory skin diseases including atopic dermatitis (AD) and psoriasis (PSO) are underpinned by dendritic cell (DC)–mediated T cell responses. Currently, the heterogeneous human cutaneous DC population is incompletely characterized, and its contribution to these diseases remains unclear. Here, we performed index-sorted single-cell flow cytometry and RNA sequencing of lesional and nonlesional AD and PSO skin to identify macrophages and all DC subsets, including the newly described mature LAMP3+BIRC3+ DCs enriched in immunoregulatory molecules (mregDC) and CD14+ DC3. By integrating our indexed data with published skin datasets, we generated a myeloid cell universe of DC and macrophage subsets in healthy and diseased skin. Importantly, we found that CD14+ DC3s increased in PSO lesional skin and co-produced IL1B and IL23A, which are pathological in PSO. Our study comprehensively describes the molecular characteristics of macrophages and DC subsets in AD and PSO at single-cell resolution, and identifies CD14+ DC3s as potential promoters of inflammation in PSO.
Introduction
Chronic inflammatory skin diseases such as atopic dermatitis (AD) and psoriasis (PSO) are the most common dermatologic conditions (Guttman-Yassky et al., 2011a). Both are characterized by the presence in the skin of activated T cell subtypes secreting pro-inflammatory cytokines. This T cell–mediated immune dysregulation is central to the pathogenesis of a wide range of inflammatory skin diseases; thus, understanding the factors modulating T cell priming and activation in healthy and diseased skin is key to the development of effective treatments for these diseases.
Dendritic cells (DCs) are professional APCs that act as a bridge between innate and adaptive immunity and play an important role in driving T cell–mediated cutaneous responses (Guilliams et al., 2014). Human DCs are heterogeneous and can be divided into two main functional groups: classical DCs (cDCs) and plasmacytoid DCs (pDCs). While pDCs exhibit more innate functions restricted to the detection of viral infections and the production of type I interferon, classical DCs include type 1 (cDC1) and type 2 (cDC2) subsets, which can detect different pathogens, produce specific cytokines, and present antigens to polarize naive CD4+ and CD8+ T cells (Satpathy et al., 2012). Blood cDC2 can be divided into two fractions according to the expression of CD5, which differ in the induction of T cell differentiation (Yin et al., 2017). We also recently described a new subset of inflammatory CD5−CD163+CD14+ DC (DC3) in human blood (Dutertre et al., 2019), whose ontogeny and functions remain unknown and are a matter of debate (Bourdely et al., 2020; Cytlak et al., 2020). DC3s do not derive from DC progenitors or common monocyte progenitors, but are thought to derive from a progenitor upstream of the common monocyte progenitor stage (Bourdely et al., 2020; Cytlak et al., 2020). In addition, although the cytokines produced by DC3 after stimulation in vitro are known (Bourdely et al., 2020; Brown et al., 2019), DC3 function in vivo and contribution to disease pathophysiology remain poorly characterized. DC3s were found expanded in the blood of patients with the autoimmune disease systemic lupus erythematosus (Dutertre et al., 2019), but whether they are present in the skin and their involvement in human skin inflammation were unknown until recently (Cytlak et al., 2020).
Current knowledge of the cutaneous APC compartment defines four major groups: Langerhans cells in the epidermis, cDC1 and cDC2 in the dermis, and macrophages (Kashem et al., 2017). Langerhans cells acquire antigens from the epidermis and contribute to the differentiation of T helper type 2 (Th2), Th17, and regulatory T cells (Bieber, 1995; Kashem et al., 2017; Seneschal et al., 2012). In addition, cDC1s are important for Th1 and cytotoxic T cell differentiation, while cDC2s are important for Th2 and Th17 cell induction (Kashem et al., 2017). Furthermore, upon inflammation, blood monocytes are recruited and differentiate locally, giving rise to inflammatory cells with a DC-like phenotype (Shi and Pamer, 2011).
Recently, the single-cell RNA sequencing (RNA-seq) approach has been used to analyze the DC population in human skin. Xue et al. (2020) reported two cDC2 subsets, whereas Cytlak et al. (2020) reported the presence of CD141+ cDC1, CD1c+CD14− DC2, and CD1c+CD14+ DC3 in both human blood and dermis. These findings suggest that DC3 is also present in human skin, but their role in disease remains unclear. Thus, to address the role of DCs in chronic inflammatory skin diseases, we used single-cell flow cytometry and RNA-seq of index-sorted cells from healthy and diseased skin to generate an unbiased profile/landscape of DCs and macrophages, and to describe their distinct molecular signatures and proportions in skin lesions of AD and PSO patients. This uncovered a significant enrichment in the proportion of CD14+ DC3s in PSO lesional skin, where they were one of the major cell types coexpressing IL1B and IL23A, two cytokines essential for PSO pathogenesis (Cai et al., 2019; Fitch et al., 2007). This finding suggests that targeting CD14+ DC3 might represent a novel therapeutic option in the treatment of PSO, and demonstrates the potential for the single-cell myeloid cell landscape database to provide important insights into skin biology in health and disease.
Results
Annotation of skin APCs by protein and gene expression
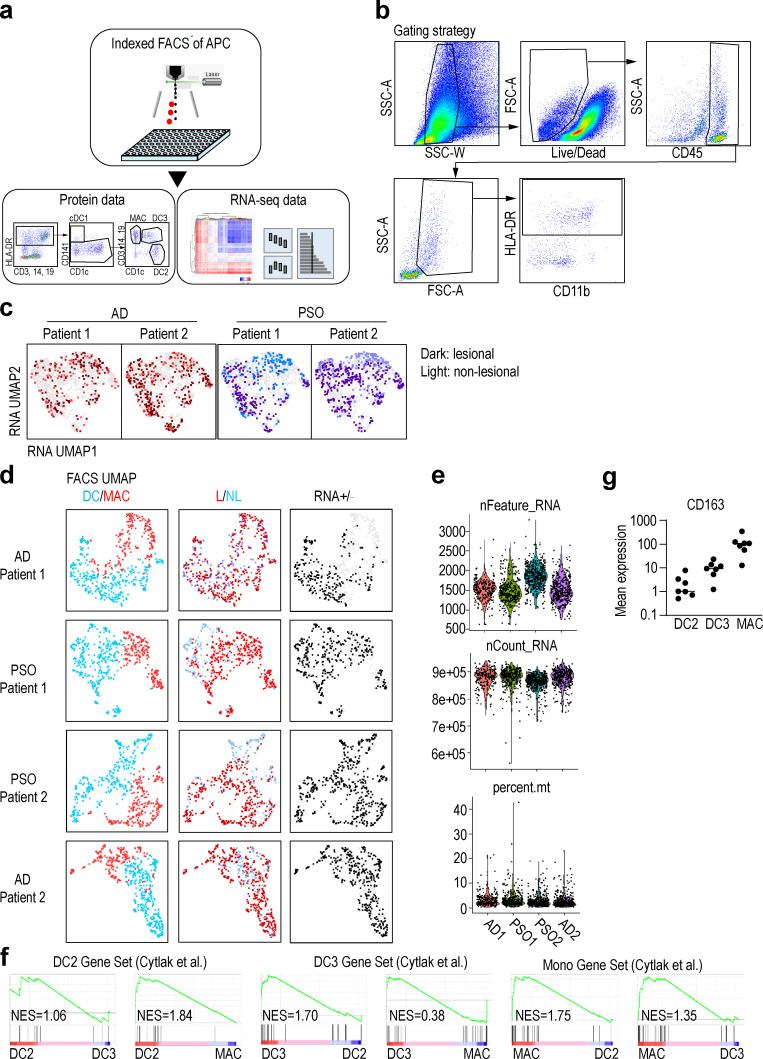
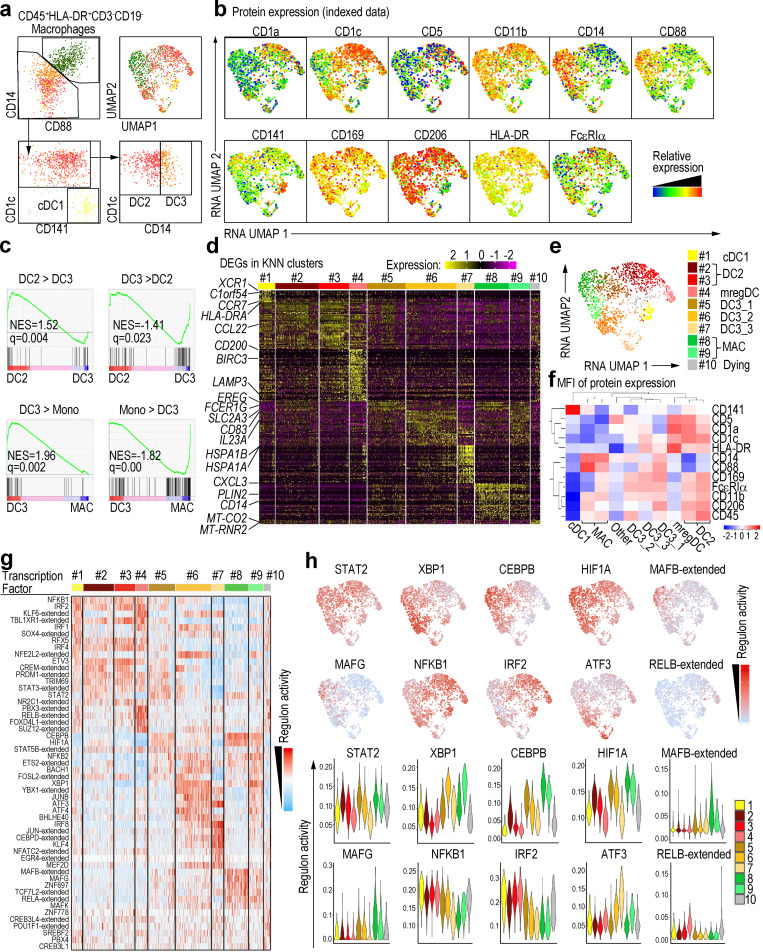
We collected skin biopsies from two patients with AD and two with PSO, from both nonlesional and lesional areas, and prepared single-cell suspensions by enzymatic digestion (Fig. S1 a and Table S1, a and b). We identified and index-sorted cutaneous DCs and monocyte-macrophages using flow cytometry based on expression of characteristic patterns of surface markers/proteins (Fig. S1 b) before subjecting each index-sorted cell to single-cell RNA sequencing (scRNA-seq) using the Smart-seq2 protocol. First, to reduce the effects of inter-individual variability, we integrated the RNA expression data from each patient using the Seurat V3 pipeline (Stuart et al., 2019). We then mapped these data into a uniform manifold approximation and projection (UMAP) space to allow identification of cell clusters based on transcriptional similarities (Fig. S1, c–e), before overlaying heat maps of surface protein expression from the flow cytometry data onto the integrated UMAP-identified cell subsets to identify CD141+ cDC1, CD1c+CD88− cDC2, and CD1c−CD88+CD14+ macrophages (Fig. 1, a and b). Since CD88 is a marker expressed on monocytes and macrophages but not on DCs and cDC2s comprise CD5+CD14− DC2 and CD5−CD14+ DC3 (Dutertre et al., 2019), we divided cDC2 into CD14− (DC2) and CD14+ (CD14+ DC3) subsets. Gene set enrichment analysis (GSEA) using previously reported gene signatures of DC and monocyte subsets (Cytlak et al., 2020; Villani et al., 2017) revealed that CD1c+CD14+ cells were more enriched for the DC3 gene signature than DC2 gene signature compared with CD1c+ cells. In addition, CD1c+CD14+ cells were more enriched for the DC3 gene signature than monocyte gene signature compared with CD14+ cells (Fig. 1 c and Fig. S1 f). CD163 protein expression was tested by cytometry by time of flight (CyTOF), and CD14+ DC3s expressed a lower level of CD163 than macrophages, but higher than DC2s (Fig. S1 g), consistent with previous reports (Bourdely et al., 2020; Dutertre et al., 2019). Alongside this, we also clustered the cells in an unsupervised way based on RNA expression by using the k-nearest neighbor algorithm (KNN), then analyzed differentially expressed genes (DEGs) in each cluster to confirm the annotation of the cell subsets defined based on indexed cell protein expression data (Fig. 1, d and e). Together these approaches revealed that cluster #1 corresponded to cDC1 (XCR1+C1orf54+), and clusters #2–7 likely corresponded to cDC2. cDC2s here, defined at the protein level as CD1c+CD88−, were divided into CD14− (DC2, clusters #2 and #3) and CD14+ (CD14+ DC3, #5, #6, and #7) subsets. Cutaneous CD14+ DC3 expressed EREG, SLC2A3, IL23A, and HSPA genes, which were not reported as being expressed by DC3 in the blood, likely indicating skin-specific CD14+ DC3 differentiation in response to local cues. We also detected a cluster of cells highly expressing genes normally associated with mature DCs enriched in immunoregulatory molecules (mregDC, #4), including CD200 and CD274 (Chen et al., 2020; He et al., 2020; Maier et al., 2020). Finally, clusters #8 and #9 corresponded to macrophages, while cluster #10, enriched for mitochondrial gene expression, corresponded to low viability cells (Luecken and Theis, 2019). Our analysis of index-sorted cells’ protein expression with KNN clusters confirmed the cell subset identification described above (Fig. 1 f).
Figure S1.
Sample information.(a) Skin cells from lesional (L) and nonlesional (NL) skin samples from AD (n = 2) and PSO (n = 2) patients were labeled for 12 surface makers. CD45+HLA-DR+ cells were index-sorted by flow cytometry, and expression of the panel of surface proteins was measured on individual cells. Sorted cells were also analyzed by RNA-seq to obtain RNA expression profile. (b) Gating strategy of the flow cytometry data analyzed by Smart-seq2 scRNaseq of Fig. 1. (c) RNA-based UMAP dimensional reduction of skin APC data from the four patients. The darker color dots indicate the cells in lesional skin, and the lighter color dots indicate the cells in nonlesional skin. (d) Information on skin lesion and quality control (QC) in each patient's DC and macrophages. Data from DC/macrophage, lesional/nonlesional skin, and RNA ± (QC pass or not) were overlaid onto the UMAP according to flow cytometry analysis. (e) Number of feature RNA, count RNA, and percentage of mitochondria RNA of each samples. (f) GSEA of pairwise comparisons of skin CD1c+CD14+ (CD14+ DC3) cells with CD1c+CD14− cells (DC2) or CD14+CD88+ cells (MAC). Gene signatures of blood DC2s, DC3s, or CD14+ monocytes were used (Cytlak et al., 2020). (g) Mean expression of CD163 protein by DC2, DC3, and macrophage populations measured by CyTOF (n = 7). NES, normalized enrichment score.
Figure 1.
Annotation of APCs in skin from patients with AD or PSO.(a) Left: Gating strategy starting from CD45+HLA-DR+CD3−CD19− defining all skin subsets of nonlesional and lesional skin of AD (n = 2) and PSO (n = 2) patients. Right: Annotation from indexed data were overlaid on RNA-based UMAP dimensional reduction. (b) Surface protein expression from indexed data were overlaid on RNA-based UMAP dimensional reduction. (c) GSEA of pairwise comparisons of CD1c+CD14+ cells with CD1c+ cells or CD14+ cells from skin. Gene signatures of blood DC3s compared with DC2s (DC3 > DC2) or CD14+ monocytes (DC3 > Mono) and, vice versa, of blood DC2s (DC2 > DC3) or CD14+ monocytes (Mono > DC3) compared with DC3s were used (Villani et al., 2017). NES, normalized enrichment score. (d) The heat map showing relative expression of the DEGs from each KNN cluster. (e) UMAP dimensionality reduction and KNN clustering of human skin APCs based on RNA expression data. Cell subsets were delineated using the 10 KNN clusters that were regrouped into major previously defined cell subsets based on the expression of surface proteins. (f) Heat map of the mean fluorescence intensity (MFI) of the surface proteins in each cluster. (g) Differentially active regulons among RNA-based KNN clusters. (h) Regulon activities of top regulons were projected on the RNA-based UMAP space and shown as violin plots across the KNN clusters. MAC, macrophage.
Single-cell regulatory network inference and clustering (SCENIC) analysis of APCs in skin from patients with AD or PSO
SCENIC analysis (Aibar et al., 2017) was performed on our skin scRNA-seq dataset to infer the global gene regulatory networks (regulons) associated with each RNA-based cell cluster. Each regulon includes a transcription factor and its putative target genes that harbor binding motifs for the transcription factor. Differential regulon activity testing revealed highly active regulons in each cluster (Fig. 1 g). IRF2 was a highly active transcription factor in clusters #1 (cDC1), #2 and #3 (DC2), and #4 (mregDC); ATF3 in clusters #6 and #7 (CD14+ DC3); RELB in cluster #4 (mregDC); MAFB and MAFG in clusters #8 and #9 (macrophages); and XBP1, CEBPB, and HIF1A in CD14+ DC3s and macrophages (Fig. 1 h). Thus, cutaneous cDC1s, DC2s, CD14+ DC3s, and macrophages exhibit differential regulon activities controlled by different nuclear transcription factors.
Generation of a skin DC and macrophage single-cell universe
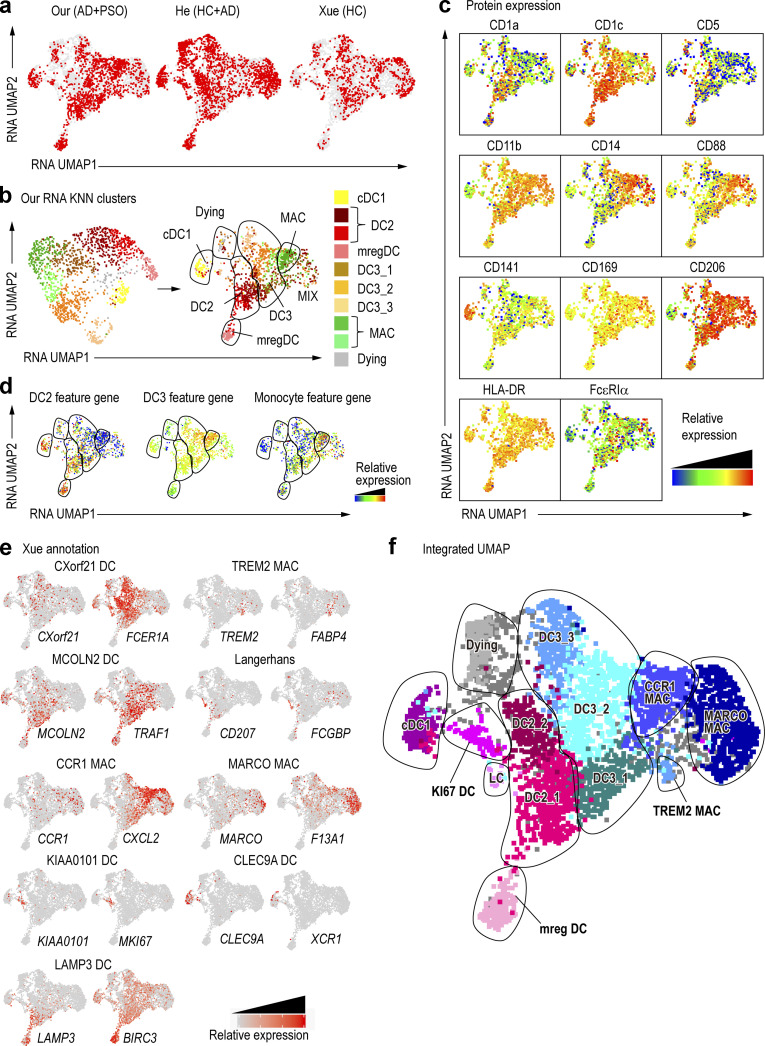
By using an indexed Smart-seq2 scRNA-seq approach, we have combined both protein and RNA expression data with deeper gene expression information (See et al., 2018), allowing unambiguous identification of myeloid cell types in the skin. However, the resources needed to achieve such resolution limited the numbers of cells that can be analyzed using this pipeline. Therefore, to extend and strengthen our findings, we integrated our data with that from other publicly available skin datasets (GEO accession no. GSE147424; He et al., 2020; Xue et al., 2020), and by using our indexed single cells as probe/reference cells to identify corresponding cell types in other datasets, we were able to generate a comprehensive skin myeloid cell universe (Table S1 c). The datasets were integrated with Seurat V3′s scTransfer to eliminate the effects of variability between them (Fig. 2 a), and we next overlaid the RNA expression–defined KNN clusters from our data (Fig. 1) onto the integrated all-data UMAP (Fig. 2 b). Each subset of cells formed a cluster, and our annotation allowed us to classify most subsets within the integrated UMAP space. Cells annotated as “MIX,” close to macrophages, were mixed cell populations that could not be precisely delineated. However, our indexed–sorted cell protein expression data showed that cells within the MIX region were positive for CD14 and CD88, suggesting they were related to macrophages (Fig. 2 c). The expression of peripheral blood DC2, DC3, and monocyte feature genes was overlaid on the integrated UMAP space (Cytlak et al., 2020; Fig. 2 d). DC2 feature gene expression was higher in DC1s and DC2s, while DC3 feature gene expression was higher in CD14+ DC3s and macrophages. Monocyte feature gene expression was higher in macrophages and the MIX region. Such analysis suggested that CD14+ DC3s, not expressing monocyte feature genes, were unrelated to monocytes, whereas the MIX population, which expressed monocyte feature genes, was related to monocytes/macrophages.
Figure 2.
Optimization of annotations through integration with published data.(a) New UMAP dimension reduction after the integration of the three datasets. HCs are healthy skin. (b) The RNA KNN cluster in Fig. 1 e is represented as an integrated UMAP. (c) Surface protein expression is overlaid onto an integrated UMAP dimensional reduction. (d) DC2, DC3, and monocyte feature gene expression shown in Cytlak et al. (2020), overlaid on UMAP. The gene list is the same as in Fig. S1 f. (e) DC and macrophage (Mac) subset signatures from Xue et al. (2020) were shown as a heat map of the specific signature genes expressed. (f) New annotations from the integration of the three datasets. LC, Langarhans cell; MAC, macrophage.
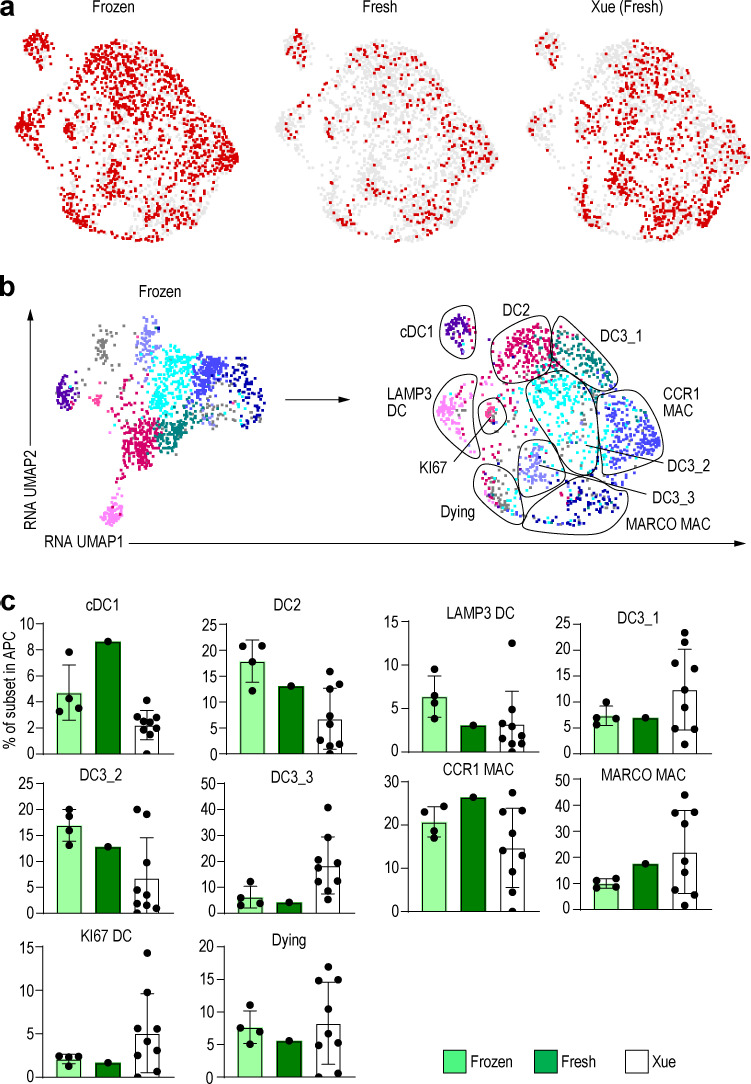
Next, we examined the expression of genes used in the annotations of Xue et al. (2020). This analysis indicated that cells within the MIX population were positive for MARCO and F13A1, which allowed us to annotate them as MARCO+ macrophages. Proliferating DCs, Langerhans cells, and TREM2-expressing macrophages were also identified in the same way (Fig. 2, e and f). However, in the Xue et al. (2020) dataset, it was difficult to clearly separate DC2s from CD14+ DC3s because there was no surface marker information, and expression of the DC3 marker CD14 was weak. Nevertheless, by combining our dataset with their reported dataset, we increased the number of studied cells and provided protein expression data from our index-sorting, thereby confirming our cell subset identification, allowing us to obtain a greater resolution of macrophage subsets. Of note, cell suspensions used in our study were frozen after enzymatic treatment and thawed before index-sorting, a process that could explain why our data showed a reduced proportion of certain cell subset. When comparing the frequency of cell subsets in fresh versus frozen protocols, fewer MARCO+ macrophages were detectable in frozen versus fresh samples (Fig. S2, a–c), highlighting the need to consider the cell-specific sensitivity to experimental conditions and the biases it can induce in their representation.
Figure S2.
Comparison of fresh and frozen samples.(a) UMAP dimension reduction after the integration of the frozen dataset, fresh dataset, and dataset from Xue et al. (2020). (b) RNA KNN cluster in Fig. 2 e is represented as a fresh-frozen integrated UMAP. (c) Bar graph of the percentage of each DC and macrophage (MAC) subset in frozen dataset, fresh dataset, and dataset from Xue et al. (2020).
Psoriatic skin has increased proportions of CD14+ DC3s and macrophages
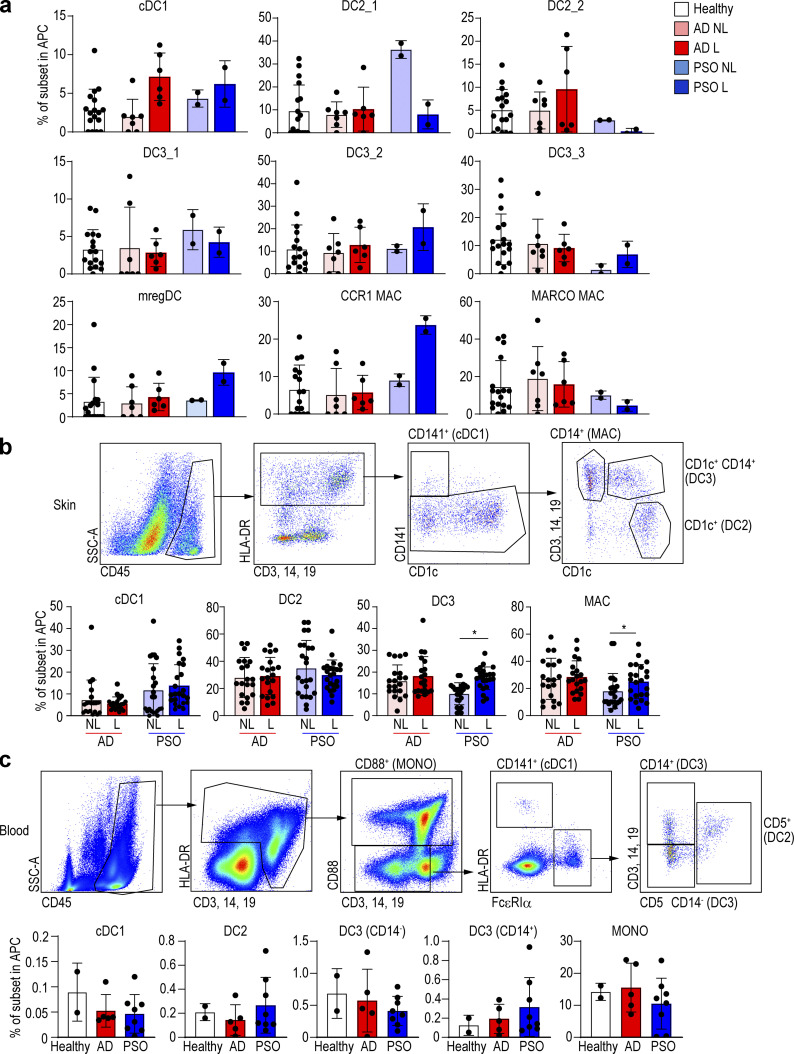
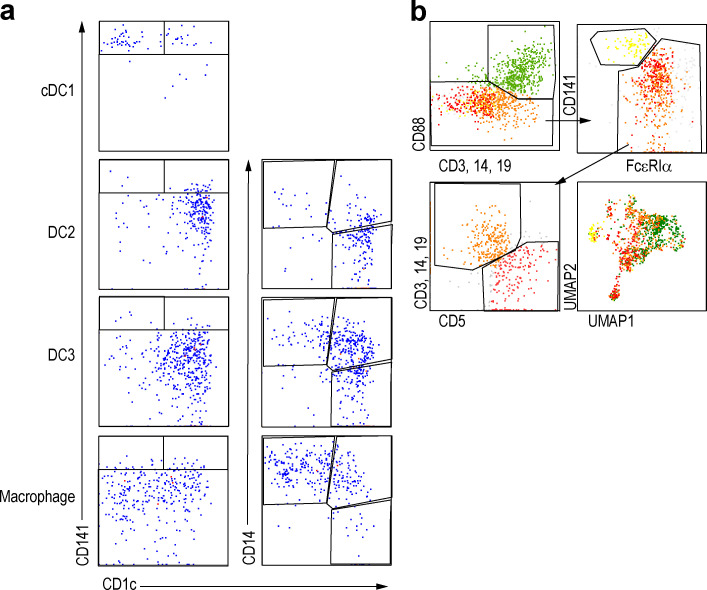
We then examined the relative proportions of each DC and macrophage subset in healthy and diseased skin conditions. In AD lesional skin, only cDC1s were relatively increased according to our scRNA-seq data, while in PSO, the proportions of cDC1s, CD14+ DC3s, and CCR1+ macrophages were relatively higher in lesional skin (Fig. 3 a). Because our scRNA-seq data were based on few patients, we aimed to validate our observations and thus compared the frequencies of each subset in skin and blood using flow cytometry on additional patients (skin: 14 AD and 16 PSO; blood: 5 AD and 8 PSO). We found that the proportions of CD14+ DC3 and macrophages were higher in PSO lesional skin as compared with nonlesional skin (Fig. 3 b and Fig. S3 a). However, in AD, there was no difference in cell population abundance between nonlesional and lesional skin regions. Next, we compared the proportions of DC subsets and monocytes in the blood between AD and PSO patients and healthy subjects (Dutertre et al., 2019; Fig. S3 b), but there was no significant difference between these groups (Fig. 3 c). Thus, measuring blood DC and monocyte subset proportions cannot be used as an indicator of PSO and AD disease activity.
Figure 3.
CD14+ DC and macrophage (MAC) subsets of skin and blood in healthy, AD, and PSO samples.(a) Bar graph of the percentage of each DC and macrophage subset in healthy, nonlesional (NL), and lesional (L) skin from integrated scRNA-seq data. (b and c) Flow-cytometric analysis of each DC and macrophage in (b) skin and (c) blood of healthy subjects and AD (14 skin and 5 blood) and PSO (16 skin and 8 blood) patients. Top: Dot plot of flow cytometry. Bottom: Bar graph of the percentage of each DC and macrophage sub-population. P values were obtained by Wilcoxon matched-pairs signed-rank test (b) and Dunn’s multiple comparisons test (c). *, P ≤ 0.05. MAC, macrophage; MONO, monocyte.
Figure S3.
Index data for human skin.(a) Flow-cytometric panels for each fraction of the combined UMAP (Fig. 2). (b) Flow-cytometric panels of human skin performed with the same gating as in Fig. 3 c.
Analysis of the functional profiles of skin DC and macrophage subsets
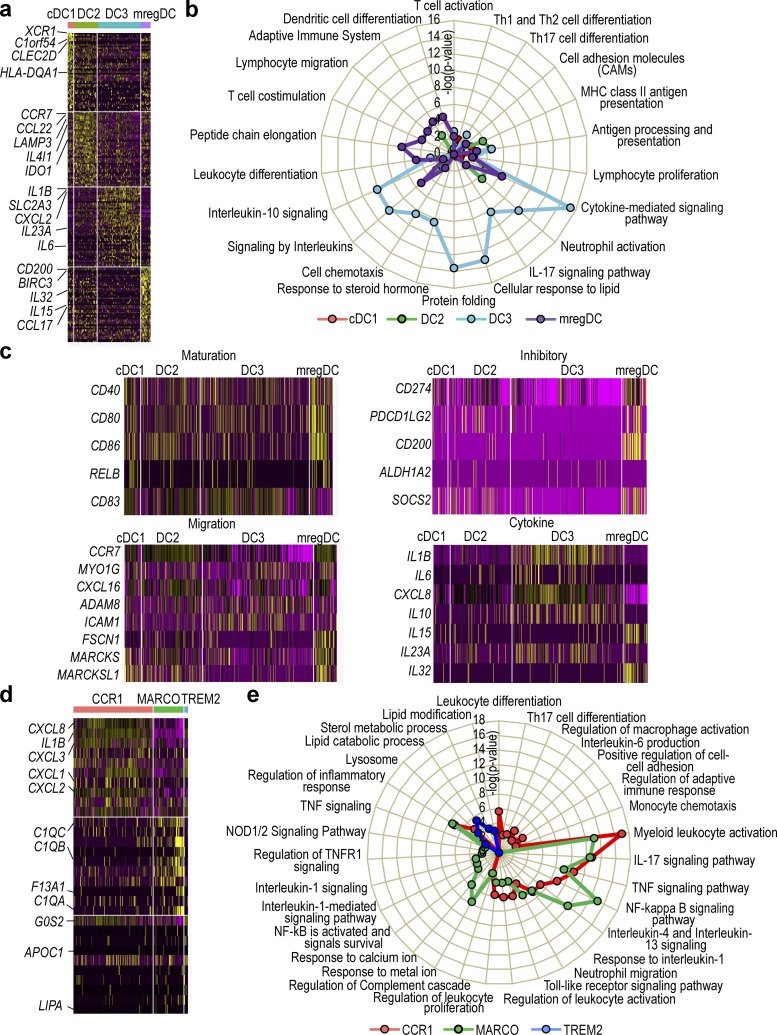
Having delineated all major DC and macrophage subsets in the skin, we next reanalyzed their gene expression profiles in conjunction with functional annotation. cDC1s and DC2s showed high expression of genes related to antigen presentation signaling and T cell differentiation such as HLA-DQA1 and HLA-DR, while CD14+ DC3s highly expressed genes related to IL-17 signaling and neutrophil activation such as IL23A and CXCL2, and mregDCs highly expressed genes related to DC differentiation and lymphocyte migration such as IRF4 and CCL17 (Fig. 4, a and b). As expected, most genes involved in maturation, migration, regulation, and inflammation that have been reported in a prior study (Maier et al., 2020) were highly expressed in mregDCs (Fig. 4 c). When we looked at cytokine gene expression, we found that IL1B, CXCL8, IL10, and IL23A were abundantly expressed in CD14+ DC3s, while IL15 and IL32 were expressed in mregDCs (Fig. 4 c). Thus, cDC1s and DC2s have gene expression patterns consistent with high antigen-presenting ability, and CD14+ DC3s with high cytokine-producing ability. Cutaneous mregDCs expressed high levels of inhibitory and migratory genes as well as IL15 and IL32. Next, we characterized the functional gene expression profile of macrophage subsets. CCR1+ macrophages showed high expression of genes related to inflammatory cytokines and chemokines including CXCL8, CXCL2, and IL1B, while MARCO+ macrophages expressed chemokine genes and genes involved in the complement cascade such as C1QB and C1QC, and TREM2+ macrophages expressed lipid-related genes such as LIPA (Fig. 4, d and e).
Figure 4.
Classification of DC and macrophage subsets in healthy, AD and PSO samples.(a) Heat map of DEG expressed in each DC subset. (b) Pathway analysis of each DC subset. (c) Heat maps of expressed genes for maturation, regulatory, migration, cytokine in each DC subset. (d) Heat map of DEG expressed in each macrophage subset. (e) Pathway analysis of each macrophage subset.
mregDCs produce IL-15 in skin lesions of AD and PSO patients
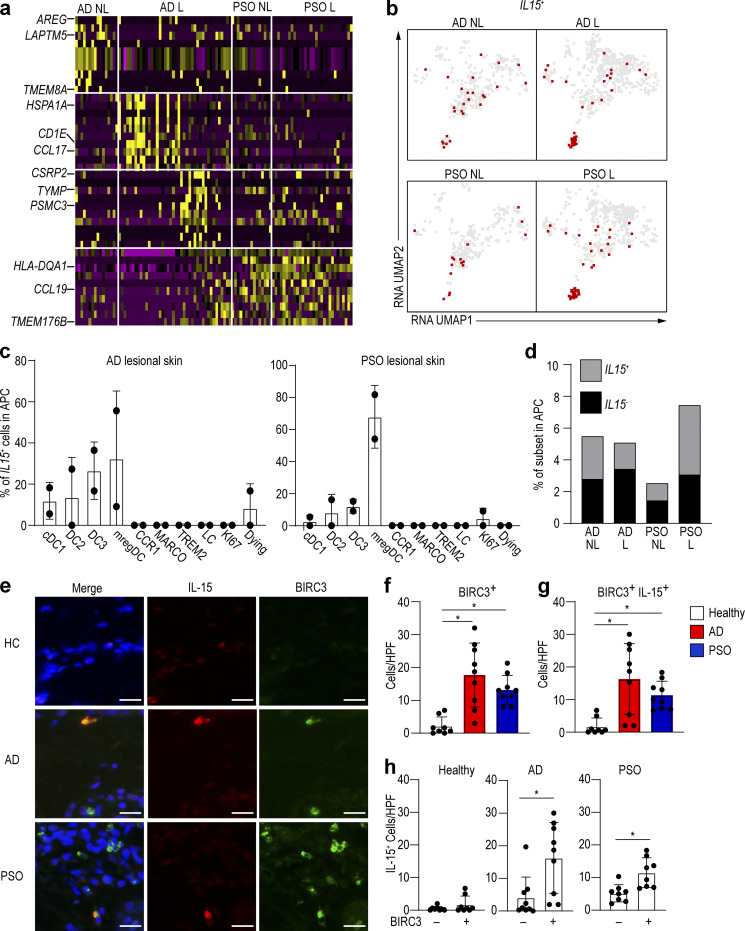
We next compared the gene expression profiles of mregDCs in lesional versus nonlesional skin of AD and PSO patients in our dataset. The expressions of heat shock proteins and CCL17, both being indicators of AD, were higher in AD lesional skin (Fig. 5 a). In PSO, we found that expression of MHC-II (HLA-DQA1) and CCL19, which attracts T cells, was higher in lesional than nonlesional skin (Fig. 5 a). IL-15 is known to be an exacerbating factor of inflammation in AD and PSO (Lv et al., 2012; Mack et al., 2020). IL15 transcripts were mostly detected within mregDCs isolated from PSO and AD lesional compared with nonlesional skin, but the difference was more pronounced in PSO (Fig. 4 c; and Fig. 5, b and c). Interestingly, we found that the increased proportion of mregDCs in PSO lesional skin occurred mostly within the IL15+ mregDC population (Fig. 5 c). The percentage of IL15+ cells in mregDCs also increased with lesional skin in PSO (Fig. 5 d). We validated this observation by immunolabeling of skin sections to determine whether mregDCs produced IL-15 at the protein level in AD and PSO lesions. Because BIRC3 is highly expressed in mregDCs (Fig. 1 d), we used it as a marker for mregDCs. We observed that BIRC3+ cells (mregDCs) were more abundant in AD and PSO lesional skin compared with healthy control skin, and that ∼80% of them produced IL-15, which also tended to be increased in AD and PSO skin (Fig. 5, e–g). In addition, the majority of the IL15-producing cells were BIRC3+ cells in AD and PSO (Fig. 5 h). These data suggest that mregDCs are more frequent in these chronic inflammatory skin conditions, where they produce IL-15 and other cytokines that could contribute to pathology.
Figure 5.
mregDCs produce IL-15 and are more abundant in AD skin.(a) Heat map comparing relative gene expression of mregDC in AD and PSO nonlesional (NL) and lesional (L) skin in our data. (b) Cells expressing IL15 were plotted onto the integrated UMAP of our data. (c) Percentage of IL15-producing cells in lesional skin from AD and PSO in our data. (d) Proportion of IL15-producing cells in AD and PSO skin. (e–h) Immunolabeling for IL-15 and BIRC3 in normal (n = 8), AD (n = 9), and PSO (n = 9) skin. Blue: DAPI, red: IL-15, green: BIRC3. Scale bar = 20 µm. (f–h) Bar graph of the number of BIRC3 (f), BIRC3/IL-15 (g), and IL-15 (h)–positive cells per high-power field (HPF; ×40) of view in healthy, AD, and PSO skin. P values were obtained by Dunn’s multiple comparisons test (f and g) and Mann–Whitney test (h). *, P ≤ 0.05. HC, healthy control.
CD14+ DC3s coexpress both IL1B and IL23A in lesional skin of PSO patients
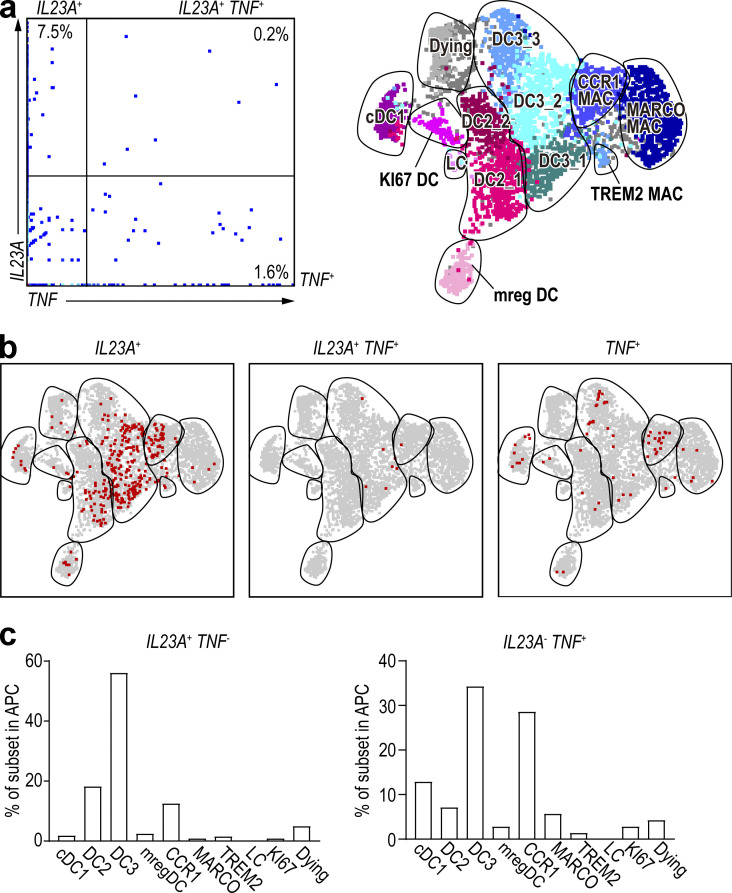
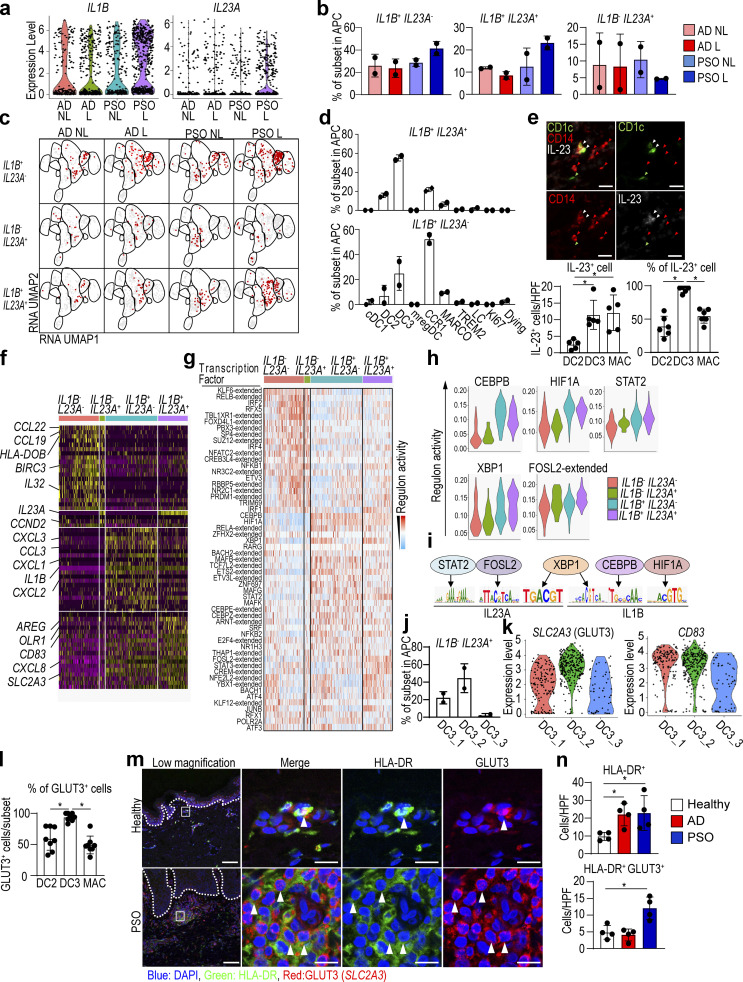
IL-1β and IL-23A cytokines play important roles in the pathogenesis of PSO (Tsai and Tsai, 2017). Early reports suggested that TNF/inducible nitric oxide synthase–producing DCs (TIP-DCs) can produce IL-23A in inflamed skin (Lee et al., 2004); therefore, we first examined whether this was the case for TNF-producing cells in our integrated dataset. We found that the majority of cells expressed either IL23A or TNF transcripts (Fig. S4, a and b), suggesting that IL23A-producing cells and TNF-expressing cells are distinct. When projected onto the integrated UMAP space, IL23A-expressing cells mostly belonged to the CD14+ DC3 population, while TNF-expressing cells mostly belonged to CD14+ DC3s and CCR1+ macrophages (Fig. S4 c). As IL-1β works alongside IL-23A in PSO pathogenesis, we next asked whether the IL23A-expressing cells also expressed IL1B transcripts. We found that both the overall expression level of IL1B and IL23A transcripts (Fig. 6 a) and the frequency of IL1B single-positive and IL1B/IL23A double-positive cells (Fig. 6 b) were higher in PSO lesional skin than in nonlesional skin. When projected onto the integrated UMAP space, the majority of cells expressing IL1B alone were CCR1+ macrophages, while most of the IL1B/IL23A-coexpressing cells were CD14+ DC3s (Fig. 6, c and d). In contrast, IL23A mono-production occurred throughout all DC subsets (Fig. 6 c). Finally, we used immunohistochemistry to confirm that CD14+ DC3s produce IL-23. Staining of PSO lesional skin with antibodies against CD1c, CD14, and IL-23 showed that the main sources of IL-23 were CD14+ DC3s and macrophages. The number of IL-23–producing cells did not differ between CD14+ DC3s and macrophages, but most CD14+ DC3s produced IL-23 (Fig. 6 e), which was consistent with the results of our scRNA-seq analysis.
Figure S4.
TNF-producing cells and IL23A-producing cells are different.(a) Dot-plots of RNA expression of all cells of the integrated dataset. (b) IL23A-, IL23A/TNF double-, and TNF-positive cells were overlaid on UMAP, respectively. (c) Bar graph showing percentage of IL23A and TNF single-positive cells within each DC and macrophage (MAC) subset. LC, Langarhans cell.
Figure 6.
CD14+ DC3s produce both IL1B and IL23A in PSO.(a) Violin plot of the IL1B- and IL23A-producing cells in nonlesional (NL) and lesional (L) skin in AD and PSO in our dataset. (b and c) Bar graph (b) and dot plot (c) of IL1B- and IL23A-producing cells in nonlesional and lesional skin from AD and PSO patients. (d) Bar graph of the percentage of IL1B and IL23A double-positive and IL1B single-positive cells within each DC and macrophage subset in PSO lesional skin. (e) Top: Immunolabeling for CD1c (green), CD14 (red), and IL-23 (white) in PSO lesional skin (n = 6). Green arrowhead: DC2, red arrowhead: macrophage, white arrowhead: CD14+ DC3. Scale bar = 20 µm. Bottom: Bar graphs show absolute number and percentage of IL-23–positive cells among DC2s, CD14+ DC3s, and macrophages. (f) Heat map of DEG in IL1B/IL23A double-positive cells in lesional PSO skin. (g–i) SCENIC analysis of IL1B/IL23A expression cells in lesional PSO skin. (g) Differentially active regulons among cells clustered based on expression of IL1B and IL23A. (h) Violin plots of regulons with higher activity in IL1B/IL23A double-positive cells. (i) IL23A and IL1B are the target genes for STAT2, FOSL2, XBP1, CEBP, and HIF1A. (j) Bar graph of the percentage of CD14+ DC3 subsets within IL1B and IL23A double-positive cells in PSO lesional skin. (k) Violin plots of SLC2A3 in the PSO lesional skin CD14+ DC3 subsets. (l) Bar graph showing the percentage of GLUT3-positive cells per each APC in PSO patient skin (n = 8). (m) Immunofluorescence labeling of healthy (n = 4) and PSO (n = 4) patient skin. Dotted line shows the dermal–epidermal junction. HLA-DR: green, GLUT3 (SLC2A3): red, and DAPI: blue. Scale bar = 100 µm (low magnification) and 10 µm (high magnification). (n) Bar graph of the number of HLA-DR and HLA-DR/GLUT3 double-positive cells per high-power field (HPF; ×60) of view in healthy (n = 4), AD (n = 4), and PSO (n = 4) patient skin. P values were obtained by Dunn’s multiple comparisons test (e, l, and n). *, P ≤ 0.05. MAC, macrophage.
We then asked whether there was a specific marker expression pattern associated with IL1B/IL23A-coexpressing cells, and found that they were characterized by CD83, an activation marker for DCs (Zhou and Tedder, 1995), AREG and EREG associated with fibrosis (Zhang et al., 2021), and the receptors for glucose and lipids, OLR1 and SLC2A3 (Yu et al., 2010; Fig. 6 f).
Additionally, inferring the differential regulon activity in lesional PSO using SCENIC analysis revealed that the active regulon landscape of IL1B/IL23A double-positive cells is different from those of single-positive or double-negative cells (Fig. 6, g and h). STAT2, FOSL2, XBP1, CEBPB, and HIF1A were detected among the top active regulons in IL1B/IL23A double-positive cells. Interestingly, and based on the motif enrichment analysis, STAT2 and FOSL2 were suggested to potentially regulate expression of IL23A, and also CEBPB and HIF1A can regulate IL1B expression. There are binding motifs for XBP1 on both IL23A and IL1B loci as well (Fig. 6 i). Altogether, these findings further support the notion that in lesional PSO, CD14+ DC3s might be a major source for co-production of IL23A and IL1B, probably mediated by transcription factors such as STAT2, FOSL2, XBP1, CEBPB, and HIF1A. However, such analysis requires further validation using other methods such as assay for transposase accessible chromatin with high-throughput sequencing and chromatin immunoprecipitation sequencing.
The majority of IL1B/IL23A double-positive CD14+ DC3s are SLC2A3+ cells
Next, we analyzed cells falling within the three CD14+ DC3 clusters (Fig. 1 e). Since DC3_2 and DC3_3 were increased in PSO lesions (Fig. 3 a), DC3_2 and DC3_3 may be involved in the pathogenesis of PSO. We also uncovered that the highest proportion of IL1B/IL23A double-positive cells was falling within the DC3_2 cluster (Fig. 6 j). We then compared the expression of CD83 and SLC2A3, highly expressed surface antigens in IL1B/IL23A double-positive cells, in the CD14+ DC3 subset (Fig. 6 k). We found that DC3_2 had the highest expression of SLC2A3, a gene coding for the membrane protein glucose transporter 3 (GLUT3), and immunostaining showed a higher percentage of GLUT3 positivity in CD14+ DC3s than in DC2s or macrophages (Fig. 6 l). In PSO lesions, the number of GLUT3– and HLA-DR–double-positive cells was increased at the site of accumulation of lymphocytes in the superficial dermis (Fig. 6, m and n). These results indicate that GLUT3+ CD14+ DC3s are more abundant in PSO lesional skin and may produce IL-23A.
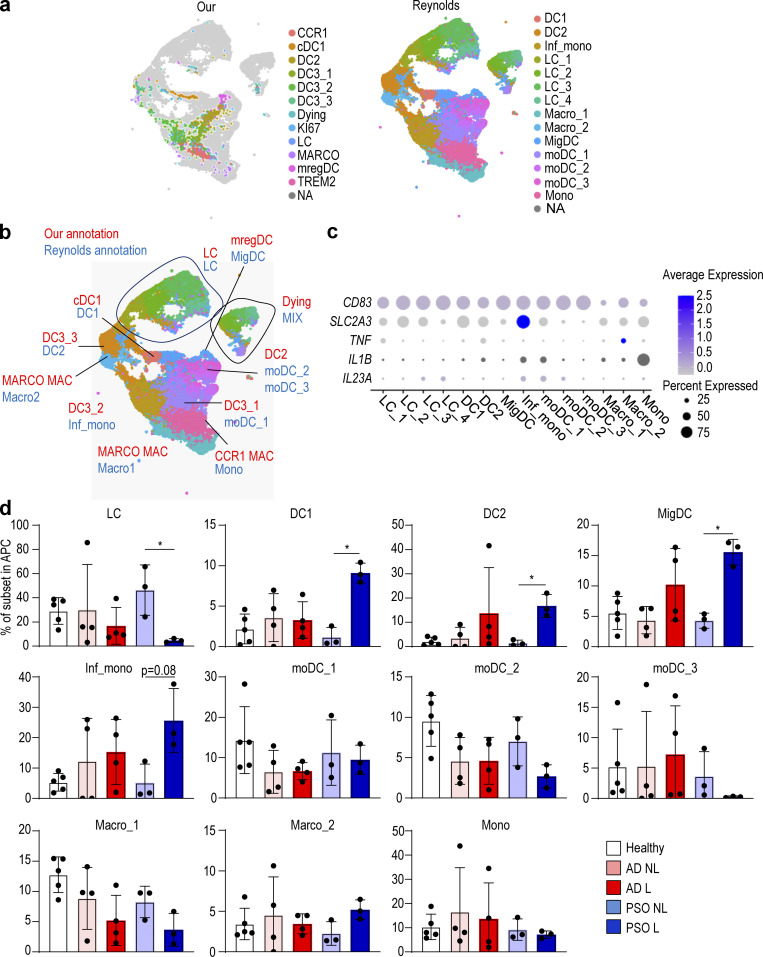
Finally, to test whether our results could be verified in a recently published skin dataset with AD and PSO biopsies (Reynolds et al., 2021), we integrated this new dataset (Popescu and Goh, 2021) with our indexed Smart-seq2 dataset (Fig. 7, a and b) and identified CD14+ DC3s by examining which fractions in the Reynolds et al. (2021) dataset correspond to the fractions we identified as DC3s. Consistent with our previous findings, we found that CD14+ DC3 (Inf_mono and moDC_1 in the Reynolds et al. [2021] annotation) expressed IL1B and IL23A (Fig. 7 c), and that the number of DC3_2 (Inf_mono in the Reynolds et al. [2021] annotation) was increased in PSO lesions (Fig. 7 d).
Figure 7.
In the Reynolds et al. (2021) dataset, DC3s produce IL1B and IL23A in PSO lesional skin.(a) UMAP visualization of APC integration of our dataset and the dataset from Reynolds et al. (2021). (b) Comparison of annotations between our dataset and the datasets from Reynolds et al. (2021). (c) Dot plot of IL1B, IL23A, and surface antigen expression in each cell subsets in the dataset from Reynolds et al. (2021). (d) Bar graph showing the percentage of each DC and macrophage (Mac) subset in healthy, nonlesional (NL), and lesional (L) skin from the dataset from Reynolds et al. (2021). P values were obtained by Kruskal–Wallis test (d). *, P ≤ 0.05. Mac, macrophage; Inf., inflammatory; LC, Langerhans cell; Mono mac, monocyte-derived macrophage; Mig., migratory; MoDC, monocyte-derived dendritic cell; Mono, monocyte.
Discussion
Using high-dimensional, single-cell protein and RNA expression analyses of human cutaneous APCs, we have precisely delineated all DC and macrophage subsets in the skin. By extending and deepening our dataset using publicly available resources, in combination with immunolabeling of skin sections, we also identified IL15-expressing mregDCs and IL1B/IL23A-coexpressing CD14+ DC3s in diseased skin.
It has recently been demonstrated that the cDC2 population can be divided into two subsets: DC2s (CD5+) and DC3s (CD5−; Dutertre et al., 2019). In autoimmune diseases such as systemic lupus erythematosus and scleroderma, the percentage of CD5−CD14+ DC3s in peripheral blood was increased, as was the expression of IFN-I–stimulated genes and several pro-inflammatory molecules, including TNFRSF10A, LILRB1, and TNFRSF2 (Dutertre et al., 2019). Brown et al. (2019) also classified mouse and human cDC2s into two subtypes, DC2A and DC2B, with CLEC10A− DC2As and CLEC10A+CD14+ DC2Bs. DC2Bs have been reported to promote Th17 cell differentiation compared with DC2As (Brown et al., 2019; Villani et al., 2017). Based on these correlations, it is tempting to speculate that DC2As correspond to DC2s, and DC2Bs correspond to DC3s. In our data, CD14+ DC3s also expressed genes related to Th17 cell differentiation and activation, such as IL6 and IL23A. Their number was also increased in PSO, a Th17 cell–related disease. In other words, CD14+ DC3s, which are increased in inflammation, may promote Th17 cell differentiation in the skin. Specifically in the skin, cDC2s have previously been divided into CXorf21-positive and MCOLN2-positive subpopulations (Xue et al., 2020). Here, DC2s in our data likely correspond to CXorf21-positive DCs, and CD14+ DC3s to MCOLN2-positive DCs; however, we were able to classify DC2s and CD14+ DC3s more clearly based on their differential CD14 protein expression. Interestingly, CD14 transcriptional expression in CD14+ DC3s in the skin is unclear in both our data and the data of Xue et al. (2020), but CD14 protein expression in our indexed scRNA-seq data was unequivocal, again supporting the value of such an approach. In some cases, protein expression is more stable than gene expression, and it is possible to make a clearer annotation by combining protein expression data with gene expression, as recently shown by Maier et al. (2020), who used a cellular indexing of transcriptomes and epitopes by sequencing approach (Stoeckius et al., 2017).
Another newly discovered subset of DCs in inflammatory skin diseases is mregDCs. Maier et al. (2020) identified mregDCs with high expression of immunomodulatory genes (CD274, PDCD1LG2, and CD200) and mature genes (CD40, CCR7, and IL12B) in human and mouse lungs. This subset has previously been identified in human skin, where it was thought to be associated with wound healing and exacerbation of AD (Chen et al., 2020; He et al., 2020). Importantly, mregDCs have also been identified in other pathologies including cancer but have been unfortunately named DC3s in some reports (Gerhard et al., 2021; Zilionis et al., 2019), a terminology completely unrelated the one used here (Dutertre et al., 2019) and used by other groups (Bourdely et al., 2020; Cytlak et al., 2020), describing DC3s as a DC2 subset. Here, we found that the mregDC number was increased in AD and PSO lesional skin, and that mregDCs were a major source of IL-15 among cutaneous APC. IL-15 is up-regulated in both AD and PSO skin (Karlen et al., 2020; Ong et al., 2002): in PSO, IL-15, like IL-23A, stimulates the production of IL-17A by T cells (Hoeve et al., 2006) and is significantly associated with exacerbation of both AD and PSO (Elder, 2007; Mack et al., 2020). This might be linked to IL-15’s ability to block apoptosis of T cells and keratinocytes, and thereby increase their survival (Inoue et al., 2010; Rückert et al., 2000). Together, these results suggest that modulating mregDC activity may also help to control AD and PSO.
We also identified CD14+ DC3s and CCR1+ macrophages as the main source of IL23A, which is important for PSO pathophysiology. There is no clinical doubt that IL-23A is important for PSO because the condition is controlled by administering a neutralizing antibody against IL-23A. However, there are various proposals about the elusive identity of the IL-23A–producing cells in PSO. The best-known IL-23A–producing cells are TIP-DCs (Guttman-Yassky et al., 2011b). CD11c-positive cells in PSO skin were designated as TIP-DCs because most of the CD11c-positive cells produce TNF and inducible nitric oxide synthase (Lowes et al., 2005). The surface markers that identify this cell type are HLA-DR and CD11c. In addition, CD11c-positive cells expressed IL-23A to a greater extent than CD83- or CD3-positive cells in PSO skin, indicating that TIP-DCs are the main source of IL-23A (Lee et al., 2004). However, CD11c expression is shared across cDC1s, cDC2s, and macrophages (Kashem et al., 2017), and thus cannot be used as a subset-specific marker. In our dataset, IL23A-producing cells were distinct from those producing TNF. 6-Sulfo LacNAc-positive DCs (slanDCs; CD1c−, CD11c+, CD16+, CD14lo) were also reported to produce IL-23A in PSO (Hansel et al., 2011). SlanDCs were increased in PSO skin, and a fraction of them also produce both IL-23A and TNF (Hansel et al., 2011). However, in this report, slanDCs were shown to express CD88 (C5aR) at the same level as monocytes, suggesting that slanDCs were in fact monocytes/macrophages, which is in line with findings from Dutertre et al. (2012). In addition, slanDCs are referred to monocyte-derived DCs (Haniffa et al., 2015). In our dataset, slanDCs corresponded to CCR1+ macrophages based on the gene expression of CD1C, CD11c (ITGAX), CD14, and CD16 (FCGR3A), and as reported, were one of the main producers of IL23A. This is consistent with a report that identified IL-23A–producing macrophages (Fuentes-Duculan et al., 2010). Altogether, these reports and our analysis suggest that both CD14+ DC3s and CCR1+ macrophages/slanDCs/monocyte-derived DCs are important cellular sources of IL-23A. However, we show here that a major fraction of CD14+ DC3s coexpressed both IL1B and IL23A, cytokines playing important roles in the pathogenesis of PSO (Tsai and Tsai, 2017), compared with CCR1+ macrophages in PSO lesional skin, making them a new relevant pathogenic cell population to target.
Finally, IL1B and IL23A double-positive CD14+ DC3s expressed GLUT3, a glucose transporter, on their surfaces. It is known that metabolic abnormalities such as diabetes mellitus and hyperlipidemia are more likely to occur in PSO, and that obesity worsens the disease (Gelfand, 2016). On the other hand, dietary restriction is known to alleviate disease symptoms (Gisondi et al., 2008). In addition, biguanide and thiazolidinediones, which are drugs used to treat diabetes, have been reported to improve PSO (Ip and Kirchhof, 2017). Because these drugs affect cell metabolism, they may act on IL1B and IL23A double-positive cells and modulate metabolism to suppress the production of IL1B and IL23A, which may contribute to the improvement of PSO. Hence, it might possible to discover new therapeutic targets for PSO by developing drugs that inhibit metabolism by targeting IL1B/IL23A co-producing CD14+ DC3s.
Materials and methods
Human blood and skin samples
Human samples were obtained in accordance with a favorable ethical opinion from Singapore SingHealth and National Health Care Group Research Ethics Committees (reference no. 2012/01144). Lesional and nonlesional skin biopsies (4 mm) and blood were taken from the 15 AD and 21 PSO patients (Table S1). All subjects provided institutional review board–approved consent. AD and PSO patients had no topical steroid/immunomodulator use in the previous 2 wk and no systemic immunosuppressants or phototherapy in the last 4 wk. Peripheral blood mononuclear cells were isolated by Ficoll-Paque (GE Healthcare) density gradient centrifugation. Skin was cut off the lower dermis and hypodermis, leaving the upper dermis and epidermis attached, then placed in a 12-well plate containing Worthington’s collagenase (0.80 mg/ml) plus DNase (0.05 mg/ml) in 2 ml of 10% FCS/RPMI/Pen Strep/L-glutamine and cut into very small pieces. Tissue pieces were incubated at 37°C overnight (12–16 h). Samples for scRNA-seq were placed in serum with 10% dimethyl sulfoxide and stored in liquid nitrogen. Samples for flow cytometry were analyzed without freezing. Human skin sections were obtained from healthy donors and AD and PSO patients at Kyoto University Hospital in Japan. This study was approved by the ethics committee of the Kyoto University Graduate School of Medicine (R0743).
Human cell flow cytometry and CyTOF: Labeling, staining, analysis, and cell sorting
All antibodies used for FACS, flow cytometry, and CyTOF were mouse anti-human mAbs. Anti-human CD3e (SP34-2), CD5 (UCHT2), CD11b (M1/70), CD14 (M5E2), CD19 (SJ25C1), and CD45 (HI30) were purchased from BD Biosciences. Anti-human CD1c (L161), CD88 (S5/1), CD163 (GHI), FceRIα (AER-37 [CRA-1]), and HLA-DR (L243) were purchased from BioLegend. Anti-human CD141 (AD5-14H12) was purchased from Miltenyi. Live/Dead Fixable BLUE DYE was purchased from Life Technologies. Briefly, cells were washed and incubated with Live/Dead blue dye (Invitrogen) for 30 min at 4°C in PBS and then incubated in 5% heat-inactivated FCS for 15 min at 4°C (Sigma-Aldrich). The appropriate antibodies diluted in FACS buffer (2% FCS and 2 mM EDTA in PBS) were added to the cells and incubated for 30 min at 4°C. Flow cytometry was performed on a BD FACSFortessa (BD Biosciences), and the data were analyzed using BD FACSDiva 8.0.1 (BD Biosciences) or FlowJo v.10.5.3 (Tree Star).
For CyTOF, purified antibodies conjugated to their respective lanthanide metals using the Maxpar antibody labeling kit (Fluidigm) or fluorophore-conjugated primary with anti-fluorophore metal-conjugated secondary antibodies were used for surface or intracellular staining. Cell staining was performed at room temperature in a final staining volume of 100 μl. Cells in a U-bottom 96-well plate were washed once with 200 ml FACS buffer, then stained with 100 ml 200 mM cisplatin (Sigma-Aldrich) for 5 min on ice to exclude dead cells. Cells were then washed with FACS buffer and once with PBS before fixing with 200 ml 2% paraformaldehyde (Sigma-Aldrich) in PBS overnight or longer. Bromoacetamidobenzyl-EDTA (BABE)–linked metal barcodes were prepared by dissolving BABE (Dojindo) in 100 mM Hepes buffer (Thermo Fisher Scientific) to a final concentration of 2 mM. Isotopically purified PdCl2 (Trace Sciences) was then added to the 2 mM BABE solution to a final concentration of 0.5 mM. Similarly, tetra-azacyclododecane- tetra-acetic acid–maleimide (DM)–linked metal barcodes were prepared by dissolving DM (Macrocyclics) in L buffer (Fluidigm) to a final concentration of 1 mM. RhCl3 (Sigma-Aldrich) and isotopically purified LnCl3 were then added to the DM solution at a final concentration of 0.5 mM. Six metal barcodes were used: BABE-Pd-102, BABE-Pd-104, BABE-Pd-106, BABE-Pd-108, BABE-Pd-110, and DMLn-113.
All BABE and DM-metal solution mixtures were immediately snap-frozen in liquid nitrogen and stored at −80°C. A unique dual combination of barcodes was chosen to stain each tissue sample. Barcode Pd-102 was used at a 1:4,000 dilution, Pd-104 at a 1:2,000 dilution, Pd-106 and Pd-108 at a 1:1,000 dilution, and Pd-110 and Ln-113 at a 1:500 dilution. Cells were incubated with 100 ml barcode in PBS for 30 min on ice, washed in permeabilization buffer, and then incubated in FACS buffer for 10 min on ice. Cells were then pelleted and resuspended in 100 ml nucleic acid Ir-Intercalator (Fluidigm) in 2% paraformaldehyde/PBS (1:2,000) at room temperature. After 20 min, cells were washed twice with FACS buffer and twice with water before being resuspended in water. EQ Four Element Calibration Beads (Fluidigm) were added at a 1% concentration before acquisition. Cell data were acquired and analyzed using a CyTOF mass cytometer (Fluidigm). The CyTOF data were exported in a conventional flow-cytometry file (FCS) format. Cells for each barcode were deconvolved using the Boolean gating algorithm within FlowJo.
Generation of index-sorted and Smart-seq2 single-cell transcriptome data
Skin punch biopsy cells were index-sorted using the index-sorting panel on a BD FACS ARIAIII (BD Biosciences) using a 70-µm nozzle into 96-well plates containing 3 µl lysis buffer (see below). Single-cell cDNA libraries were prepared using the Smart-seq v2 protocol (Picelli et al., 2014) with the following modifications: (i) 1 mg/ml BSA lysis buffer (Ambion Thermo Fisher Scientific); and (ii) 200 pg cDNA with 1/5 reaction of the Illumina Nextera XT kit (Illumina). The length distribution of the cDNA libraries was monitored using a DNA High Sensitivity Reagent Kit on the Perkin Elmer Labchip (Perkin Elmer). All samples were subjected to an indexed paired-end sequencing run of 2 × 151 cycles on an Illumina HiSeq 4000 system (Illumina) for ∼1 million reads per sample. Data were deposited in GEO under accession no. GSE176509.
Cluster analysis of combined immune cells
Paired-end raw reads were aligned to the human reference genome (GRCh38 version 25 release; Gencode) using RSEM version 1.3.0. Transcripts per million read values were calculated using RSEM and used for downstream analysis. Each sample was processed using Seurat using the standard transform procedure with default parameters to perform a regularized negative binomial regression based on the 3,000 most variable genes. Normalized datasets for each patient were combined using the FindIntegrationAnchors and IntegrateData functions in Seurat with the default value of 30 dimensions. The integrated dataset was scaled and processed under principal component analysis using the ScaleData and RunPCA functions in Seurat. Two-dimensional map coordinates were generated using the RunUMAP procedure (dims = 1:8, 10 [Fig 1], 1:25 [Fig. 2], and 1:50 [Fig. 7]). Cluster analysis was performed using the FindNeighbors procedure (dims = 1:8, 10 [Fig. 1] and 1:25 [Fig. 2]) and the FindClusters procedure (resolution = 1.0 [Fig. 1] and 1.5 [Fig. 2]). The FindMarkers procedure in Seurat was run on each cluster to obtain biomarker genes up-regulated in that cluster (min.pct = 0.25, test.use = “bimod”, and logfc.threshold = 0.25). For pathway analyses, lists of genes identified as cell subset–specific by the abovementioned methods were supplied to Metascape software (Zhou et al., 2019).
SCENIC analysis
The SCENIC algorithm (R package, version 1.1.2.2) was used to build and score regulons associated with each RNA-based cell cluster (Aibar et al., 2017). Each regulon includes a transcription factor and its putative target genes that harbor binding motifs for the transcription factor. The inferred regulon activity (AUCell score) was imported into the Seurat pipeline (Butler et al., 2018) for differential regulon activity testing among the cell clusters using the nonparametric Wilcoxon rank-sum test. Bonferroni correction based on all tested regulons was applied to calculate the adjusted P values.
GSEA
To statistically evaluate the enrichment of previously reported gene signatures (Gene Sets; Cytlak et al., 2020; Villani et al., 2017) in our dataset, we used pairwise comparisons using the GSEA (Mootha et al., 2003; Subramanian et al., 2005) method from the GSEA Home (https://www.broadinstitute.org/gsea). The GSEA signature list can be found in supplementary tables 3 and 6 of Villani et al. (2017): higher in CD1C_A (cluster DC2)/lower in CD1C_B (cluster DC3; HLA-DQB, HLA-DPB1, HLA-DQB1, HLA-DQA1, HLA-DQA2, DQ-A1, CD1C, HLA-DOB, P2RY14, ARL4C, CLIC2, CLEC17A, C10ORF128, FAM26F, ASAP1, SLC41A2, SLAMF7, CST7, PKIB, HSPA7, CXCL16, RUNX3, WDFY4, IL18R1, FCGR2B, MYO1E, AXL, PEA15, SIGLEC10, CD1E, GOLGA8B, IFITM1, LOC100505746, FEZ1, INSIG1, SPATS2L, GRIP1, MCOLN2, SERTAD3, PPP1R14A, UVRAG, SIGLEC6, KPNA6, LGMN, SPIB, SNURF-SNRPN, LOC645638, and TOP1MT), lower in CD1C_A (cluster DC2)/higher in CD1C_B (cluster DC3; AK307192, BACH1, CA5BP1, TSC2, SHOC2, HPCAL1, PVR, RIPK2, STIM1, ID1, IKBKE, KCNN4, EMP1, LPPR2, GPBAR1, LOC284454, MKNK1, KIAA0513, FOXO3, TMEM111, YWHAG, ECRP, TAB1, OSM, GABARAPL1, ASPH, PDLIM7, QPCT, RIN2, MRPS23, PLXND1, CLEC12A, TMEM176A, PISD, PLA2G7, TMEM141, NINJ1, AGTRAP, BLVRA, HBEGF, DMXL2, C9ORF89, IL1B, NLRP12, SORL1, NFE2, ADAM15, CCDC69, SULT1A1, TOM1, KCNE3, PYGL, SLC11A1, HK3, ACSL1, IER3, CFD, LMNA, SEPX1, TREM1, PILRA, ASGR1, TXNRD1, GLUL, PSTPIP1, CSF3R, STAB1, RETN, SERPINA1, SLC7A7, CTSD, NEAT1, CES1P1, FPR1, CD163, S100A12, CYBB, F13A1, CES1, BST1, MTMR11, CD36, MGST1, RAB3D, PLBD1, TMEM176B, CD14, FCN1, RNASE2, VCAN, S100A8, and S100A9), higher in CD1C_B (DC3)/lower in Mono1 (classical CD14++CD16− monocyte; HLA-DRB4, FCER1A, HLA-DQA2, HLA-DQA1, HLA-DQB, HLA-DPB1, HLA-DPB2, HLA-DPA1, PLD4, NDRG2, CD1C, CLEC10A, HLA-DMA, HLA-DRB6, DQ-A1, SLC38A1, PEBP1, PPA1, FABP5, GPR183, HMGN1, BHLHE40, TXN, RGS1, HLA-DOA, C1QBP, NR4A2, MAP4K1, SPINT2, ADAM28, RETN, RNASE2, ARL4C, CLIC2, MX1, PON2, FCGR2B, TMEM176B, NAPSA, ITGB7, HDAC9, FLT3, TMEM109, DUSP23, and IL2RG), lower in CD1C_B (DC3)/higher in Mono1 (classical CD14++CD16− monocyte; ZNF674, EXD1, MICU1, SYNE2, F5, PAPLN, BCL6, USP15, LOC100190986, ABCC3, UTP23, CLMN, RASGEF1B, ZNF267, GIMAP4, SAMD8, C1ORF220, ETS2, LOC100132774, CYTH4, MAP4K4, PTPRJ, LOC100128531, DQ573668, TMEM127, ZNF619, ERVK13-1, LOC91948, CR936688, MLXIPL, LOC100507032, TTYH3, AK298300, IFNGR2, SLC44A2, ZNF527, FNDC3B, CALCOCO2, FOXO3, RBP7, WNK4, AK055694, DENND3, NLRP3, ADAM10, CD93, ZNF780A, LOC158696, QPCT, ZFP106, NRIP3, LPAR6, GBP2, CCPG1, LOC100506334, TMEM136, G0S2, ZSWIM1, DPY19L2P2, C10ORF82, SPAG5, CTDSP1, LOC100505702, PLEKHM1, MAFB, ECE1, BC039319, GLOD5, NAAA, CCR1, CD82, C12ORF50, TREM1, C9ORF68, PER1, ZNF695, BST1, PIK3IP1, APOL4, ATF6B, AX746871, IGF2R, C3AR1, BC038201, MPP4, ZCCHC6, UPP1, CR1, AL832447, LRRK2, MS4A7, NINJ1, GSG1, IQSEC1, CBFA2T2, RABL5, PLAUR, ZNF788, ZDHHC20, KREMEN1, FLCN, CORO2A, NUMB, DYSF, SRRM2, FAM73A, FAM198B, PFKFB3, AK124179, ALDH1A1, CAMKK2, SIGLEC10, AK302511, SIRPB1, S100A12, DQ574721, WDR37, PHF12, MDM2, PYGL, CXCL16, NBEAL2, ZBTB16, AK127270, RNF144B, DENND5A, NPL, GPR155, HERC2P4, PGM5P2, NFAM1, FBXO15, TBXAS1, LOC100133161, LOC388312, CDC42EP3, HPSE, GAS7, LOC728558, PLEK, CYP1B1, KLRD1, SLC24A4, CRISPLD2, CHST15, LILRB2, RTN3, LOC100133331, GNS, SORL1, DMXL2, TSPAN14, BTG2, PGPEP1, LAIR2, HTRA4, PECAM1, UNC80, BCL2A1, SSH2, DENND2A, NAMPT, IRAK3, FCGR2A, TLR4, FCAR, FLJ44955, SCPEP1, ZNF665, LOC731275, IRS2, DUSP6, ACSL1, AX746880, FYB, PELI1, CD300E, C2ORF77, CYBB, FPR1, CTSA, HK3, NCF1B, CLEC4E, VMP1, HLA-F, ITGAM, SERPINB9, AQP9, CDA, SLC7A7, DOK3, SDCBP, VNN2, SOD2, LAIR1, BC013828, AX747598, ASAH1, CLEC7A, APOBEC3A, ABCC9, CD68, CFD, AL137655, EVI2B, LRP1, CTSD, C5AR1, NCF1C, SLC11A1, SERPINA1, NCF1, and CD14); and Fig. 2 H of Cytlak et al. (2020): blood DC2 gene set (HAVCR2, IRF4, TRAF2, TRAF4, FLT3, BLNK, HLA-DOB, CD45RA, IL18R1, CLNK, SLAMF7, LILRA4, CD22, ZEB1, BTLA), blood DC3 gene set (HLA-DRB3, TRAF1, HLA-DRA, NFKBIZ, PLAUR, CD45RO, CD40, FCGR2A, FCGR2C, TLR7, MAFF, CD83, IL1R1, CD209, IL1B, CCL4, PTGS2, LAMP3, IL8, FCGR3A, FCGR3B, FCGR2B, IL1R2, PPBP, MRC1, CXCL2, MSR1, CD207, CXCL9, PRDM1, EGR1, C1QA, C1QB, and EGR2), and blood monocyte gene set (TNFRSF10C, LILRB3, CYBB, CLEC6A, CD82, CLEC5A, PRAM1, TLR4, MARCO, S100A9, LILRB2, KCNJ2, IL15, LPAR2, GBP5, ITGAM, MERTK, NOTCH1, CFD, IKBKE, CR1, CSF3R, BST1, LILRA6, S100A8, CD14, LILRA3, S100A12, IGF2R, C19orf59, CLEC4E, ZBTB16).
Immunohistochemical analyses
Immunohistochemical labeling was performed on formalin-fixed, paraffin-embedded tissues. Antigens were retrieved by boiling in Tris-EDTA buffer, pH 9.0, using a pressure cooker. Non-specific binding of immunoglobulin G was blocked by an Image-iT FX Signal Enhancer (Thermo Fisher Scientific). The sections were incubated with antibodies recognizing HLA–D Related (HLA-DR; clone LN3; 1:50; BioLegend), HLA-DR (ab92511; 1:100; Abcam), F13A1 (FXIIIa; 1:200; Biogenesis), BIRC3 (HPA002317; 1:100; Sigma-Aldrich), IL-15 (ab55276; 1:500; Abcam), IL-23 (ab45420; 1:200; Abcam), CD1c (ab246520; 1:1,000; Abcam), CD14 (clone D7A2T; 1:200; Cell Signaling), and GLUT3 (ab15311; 1:50; Abcam) for 1 h at room temperature, and then in anti-mouse Alexa Fluor 555 (Jackson ImmunoResearch Laboratories), anti-rabbit Alexa Fluor 647, and DAPI (Thermo Fisher Scientific) for 1 h at room temperature. An opal tyramide signaling amplification kit (Akoya Biosciences) was used in case of duplication of the primary antibody host. The images were captured using a confocal laser scanning microscope (Olympus) and analyzed with ImageJ software (National Institutes of Health).
Quantification and statistical analysis
In the analysis of scRNA-seq, a significant difference was determined using bimod if the adjusted P value was <0.05. The Wilcoxon matched-pairs signed-rank test was used to compare cells in nonlesional and lesional skin in the same patient (Fig. 3 b). Dunn’s multiple comparisons test (Fig. 3 c; Fig. 5, f–h; and Fig. 6, e, l, and n), Mann–Whitney test (Fig. 5 h), and Kruskal–Wallis test (Fig. 7 d) were used to compare the median of each analyte. P > 0.05 was considered significant.
Online supplemental material
Fig. S1 shows sample information of scRNA-seq. Fig. S2 shows the comparison of fresh and frozen samples. Fig. S3 shows index data of human skin. Fig. S4 shows the TNF-producing cells and IL23A-producing cells. Table S1 shows patient information.
Supplementary Material
shows patient information. Table S1 a shows patient information of scRNA-seq and flow cytometry analysis. Table S1 b shows details of patients for scRNA-seq analysis. Table S1 c shows a comparison of the three datasets.
Acknowledgments
We thank all the members of the Ginhoux and Kabashima laboratories for helpful discussions. Flow cytometry and cell sorting were carried out on the SingHealth Flow Cytometry Core Platform.
Microscopy and RNA library preparation were carried out on Singapore Immunology Network (SIgN) platforms established by the Agency of Science, Technology and Research (A*STAR), Singapore. SIgN platforms are supported by a Biomedical Research Council grant (IAF311006) and Biomedical Research Council transition funds (#H16/99/b0/011). F. Ginhoux is supported by the European Molecular Biology Organization Young Investigator Promgramme, SIgN core funding (A*STAR), and an A*STAR-NHG-NTU skin research grant (15014). K. Kabashima is supported by SIgN and Skin Research Institute of Singapore core funding (A*STAR), Japan Society for the Promotion of Science KAKENHI (20H05697), and Japan Agency for Medical Research and Development (JP21gm1210006). B. Janela is supported by Skin Research Institute of Singapore core funding (A*STAR). S. Nakamizo is supported by Japan Society for the Promotion of Science KAKENHI (21K16211).
Author contributions: Experiments, S. Nakamizo, C.-A. Dutertre, S. Lim, J. Lum, G. Koh, C. Foong, P.J.A. Yong, K.J. Tan, R. Sato, T. Goto, and K. Tomari; data analysis, S. Nakamizo, C.-A. Dutertre, X.M. Zhang, A. Khalilnezhad, L. Yvan-Charvet, and H. He; skin samples, R. Shibuya, M. Iwata, T.S. Lucinda, M.M.Y. Tang, and C. Theng; writing of the manuscript, S. Nakamizo, C.-A. Dutertre, and F. Ginhoux; intellectual input, E. Guttman-Yassky, B. Malleret, B. Janela, V. Julia, F. Hacini-Rachinel, and K. Kabashima; project supervision, S. Nakamizo, C.-A. Dutertre, and F. Ginhoux; and study conceptualization, S. Nakamizo, C.-A. Dutertre, and F. Ginhoux.
References
- Aibar, S., González-Blas C.B., Moerman T., Huynh-Thu V.A., Imrichova H., Hulselmans G., Rambow F., Marine J.C., Geurts P., Aerts J., et al. 2017. SCENIC: single-cell regulatory network inference and clustering. Nat. Methods. 14:1083–1086. 10.1038/nmeth.4463 [DOI] [PMC free article] [PubMed] [Google Scholar]
- Bieber, T.1995. [Role of Langerhans cells in the physiopathology of atopic dermatitis]. Pathol. Biol. (Paris). 43:871–875. [PubMed] [Google Scholar]
- Bourdely, P., Anselmi G., Vaivode K., Ramos R.N., Missolo-Koussou Y., Hidalgo S., Tosselo J., Nuñez N., Richer W., Vincent-Salomon A., et al. 2020. Transcriptional and Functional Analysis of CD1c+ Human Dendritic Cells Identifies a CD163+ Subset Priming CD8+CD103+ T Cells. Immunity. 53:335–352.e8. 10.1016/j.immuni.2020.06.002 [DOI] [PMC free article] [PubMed] [Google Scholar]
- Brown, C.C., Gudjonson H., Pritykin Y., Deep D., Lavallée V.P., Mendoza A., Fromme R., Mazutis L., Ariyan C., Leslie C., et al. 2019. Transcriptional Basis of Mouse and Human Dendritic Cell Heterogeneity. Cell. 179:846–863.e24. 10.1016/j.cell.2019.09.035 [DOI] [PMC free article] [PubMed] [Google Scholar]
- Butler, A., Hoffman P., Smibert P., Papalexi E., and Satija R.. 2018. Integrating single-cell transcriptomic data across different conditions, technologies, and species. Nat. Biotechnol. 36:411–420. 10.1038/nbt.4096 [DOI] [PMC free article] [PubMed] [Google Scholar]
- Cai, Y., Xue F., Quan C., Qu M., Liu N., Zhang Y., Fleming C., Hu X., Zhang H.G., Weichselbaum R., et al. 2019. A Critical Role of the IL-1β-IL-1R Signaling Pathway in Skin Inflammation and Psoriasis Pathogenesis. J. Invest. Dermatol. 139:146–156. 10.1016/j.jid.2018.07.025 [DOI] [PMC free article] [PubMed] [Google Scholar]
- Chen, Y.L., Gomes T., Hardman C.S., Vieira Braga F.A., Gutowska-Owsiak D., Salimi M., Gray N., Duncan D.A., Reynolds G., Johnson D., et al. 2020. Re-evaluation of human BDCA-2+ DC during acute sterile skin inflammation. J. Exp. Med. 217:e20190811. 10.1084/jem.20190811 [DOI] [PMC free article] [PubMed] [Google Scholar]
- Cytlak, U., Resteu A., Pagan S., Green K., Milne P., Maisuria S., McDonald D., Hulme G., Filby A., Carpenter B., et al. 2020. Differential IRF8 Transcription Factor Requirement Defines Two Pathways of Dendritic Cell Development in Humans. Immunity. 53:353–370.e8. 10.1016/j.immuni.2020.07.003 [DOI] [PMC free article] [PubMed] [Google Scholar]
- Dutertre, C.A., Amraoui S., DeRosa A., Jourdain J.P., Vimeux L., Goguet M., Degrelle S., Feuillet V., Liovat A.S., Müller-Trutwin M., et al. 2012. Pivotal role of M-DC8+ monocytes from viremic HIV-infected patients in TNFα overproduction in response to microbial products. Blood. 120:2259–2268. 10.1182/blood-2012-03-418681 [DOI] [PubMed] [Google Scholar]
- Dutertre, C.A., Becht E., Irac S.E., Khalilnezhad A., Narang V., Khalilnezhad S., Ng P.Y., van den Hoogen L.L., Leong J.Y., Lee B., et al. 2019. Single-Cell Analysis of Human Mononuclear Phagocytes Reveals Subset-Defining Markers and Identifies Circulating Inflammatory Dendritic Cells. Immunity. 51:573–589.e8. 10.1016/j.immuni.2019.08.008 [DOI] [PubMed] [Google Scholar]
- Elder, J.T.2007. IL-15 and psoriasis: another genetic link to Th17? J. Invest. Dermatol. 127:2495–2497. 10.1038/sj.jid.5700855 [DOI] [PubMed] [Google Scholar]
- Fitch, E., Harper E., Skorcheva I., Kurtz S.E., and Blauvelt A.. 2007. Pathophysiology of psoriasis: recent advances on IL-23 and Th17 cytokines. Curr. Rheumatol. Rep. 9:461–467. 10.1007/s11926-007-0075-1 [DOI] [PMC free article] [PubMed] [Google Scholar]
- Fuentes-Duculan, J., Suárez-Fariñas M., Zaba L.C., Nograles K.E., Pierson K.C., Mitsui H., Pensabene C.A., Kzhyshkowska J., Krueger J.G., and Lowes M.A.. 2010. A subpopulation of CD163-positive macrophages is classically activated in psoriasis. J. Invest. Dermatol. 130:2412–2422. 10.1038/jid.2010.165 [DOI] [PMC free article] [PubMed] [Google Scholar]
- Gelfand, J.M.2016. Psoriasis, Type 2 Diabetes Mellitus, and Obesity: Weighing the Evidence. JAMA Dermatol. 152:753–754. 10.1001/jamadermatol.2016.0670 [DOI] [PMC free article] [PubMed] [Google Scholar]
- Gerhard, G.M., Bill R., Messemaker M., Klein A.M., and Pittet M.J.. 2021. Tumor-infiltrating dendritic cell states are conserved across solid human cancers. J. Exp. Med. 218:e20200264. 10.1084/jem.20200264 [DOI] [PMC free article] [PubMed] [Google Scholar]
- Gisondi, P., Del Giglio M., Di Francesco V., Zamboni M., and Girolomoni G.. 2008. Weight loss improves the response of obese patients with moderate-to-severe chronic plaque psoriasis to low-dose cyclosporine therapy: a randomized, controlled, investigator-blinded clinical trial. Am. J. Clin. Nutr. 88:1242–1247. [DOI] [PubMed] [Google Scholar]
- Guilliams, M., Ginhoux F., Jakubzick C., Naik S.H., Onai N., Schraml B.U., Segura E., Tussiwand R., and Yona S.. 2014. Dendritic cells, monocytes and macrophages: a unified nomenclature based on ontogeny. Nat. Rev. Immunol. 14:571–578. 10.1038/nri3712 [DOI] [PMC free article] [PubMed] [Google Scholar]
- Guttman-Yassky, E., Nograles K.E., and Krueger J.G.. 2011a. Contrasting pathogenesis of atopic dermatitis and psoriasis--part I: clinical and pathologic concepts. J. Allergy Clin. Immunol. 127:1110–1118. 10.1016/j.jaci.2011.01.053 [DOI] [PubMed] [Google Scholar]
- Guttman-Yassky, E., Nograles K.E., and Krueger J.G.. 2011b. Contrasting pathogenesis of atopic dermatitis and psoriasis--part II: immune cell subsets and therapeutic concepts. J. Allergy Clin. Immunol. 127:1420–1432. 10.1016/j.jaci.2011.01.054 [DOI] [PubMed] [Google Scholar]
- Haniffa, M., Gunawan M., and Jardine L.. 2015. Human skin dendritic cells in health and disease. J. Dermatol. Sci. 77:85–92. 10.1016/j.jdermsci.2014.08.012 [DOI] [PMC free article] [PubMed] [Google Scholar]
- Hänsel, A., Günther C., Ingwersen J., Starke J., Schmitz M., Bachmann M., Meurer M., Rieber E.P., and Schäkel K.. 2011. Human slan (6-sulfo LacNAc) dendritic cells are inflammatory dermal dendritic cells in psoriasis and drive strong TH17/TH1 T-cell responses. J. Allergy Clin. Immunol. 127:787–94.e9. 10.1016/j.jaci.2010.12.009 [DOI] [PubMed] [Google Scholar]
- He, H., Suryawanshi H., Morozov P., Gay-Mimbrera J., Del Duca E., Kim H.J., Kameyama N., Estrada Y., Der E., Krueger J.G., et al. 2020. Single-cell transcriptome analysis of human skin identifies novel fibroblast subpopulation and enrichment of immune subsets in atopic dermatitis. J. Allergy Clin. Immunol. 145:1615–1628. 10.1016/j.jaci.2020.01.042 [DOI] [PubMed] [Google Scholar]
- Hoeve, M.A., Savage N.D., de Boer T., Langenberg D.M., de Waal Malefyt R., Ottenhoff T.H., and Verreck F.A.. 2006. Divergent effects of IL-12 and IL-23 on the production of IL-17 by human T cells. Eur. J. Immunol. 36:661–670. 10.1002/eji.200535239 [DOI] [PubMed] [Google Scholar]
- Inoue, S., Unsinger J., Davis C.G., Muenzer J.T., Ferguson T.A., Chang K., Osborne D.F., Clark A.T., Coopersmith C.M., McDunn J.E., and Hotchkiss R.S.. 2010. IL-15 prevents apoptosis, reverses innate and adaptive immune dysfunction, and improves survival in sepsis. J. Immunol. 184:1401–1409. 10.4049/jimmunol.0902307 [DOI] [PMC free article] [PubMed] [Google Scholar]
- Ip, W., and Kirchhof M.G.. 2017. Glycemic Control in the Treatment of Psoriasis. Dermatology. 233:23–29. 10.1159/000472149 [DOI] [PubMed] [Google Scholar]
- Karlen, H., Yousefi S., Simon H.U., and Simon D.. 2020. IL-15 Expression Pattern in Atopic Dermatitis. Int. Arch. Allergy Immunol. 181:417–421. 10.1159/000508515 [DOI] [PubMed] [Google Scholar]
- Kashem, S.W., Haniffa M., and Kaplan D.H.. 2017. Antigen-Presenting Cells in the Skin. Annu. Rev. Immunol. 35:469–499. 10.1146/annurev-immunol-051116-052215 [DOI] [PubMed] [Google Scholar]
- Lee, E., Trepicchio W.L., Oestreicher J.L., Pittman D., Wang F., Chamian F., Dhodapkar M., and Krueger J.G.. 2004. Increased expression of interleukin 23 p19 and p40 in lesional skin of patients with psoriasis vulgaris. J. Exp. Med. 199:125–130. 10.1084/jem.20030451 [DOI] [PMC free article] [PubMed] [Google Scholar]
- Lowes, M.A., Chamian F., Abello M.V., Fuentes-Duculan J., Lin S.L., Nussbaum R., Novitskaya I., Carbonaro H., Cardinale I., Kikuchi T., et al. 2005. Increase in TNF-alpha and inducible nitric oxide synthase-expressing dendritic cells in psoriasis and reduction with efalizumab (anti-CD11a). Proc. Natl. Acad. Sci. USA. 102:19057–19062. 10.1073/pnas.0509736102 [DOI] [PMC free article] [PubMed] [Google Scholar]
- Luecken, M.D., and Theis F.J.. 2019. Current best practices in single-cell RNA-seq analysis: a tutorial. Mol. Syst. Biol. 15:e8746. 10.15252/msb.20188746 [DOI] [PMC free article] [PubMed] [Google Scholar]
- Lv, S.J., Su L., Li H., Han R.L., Sun G.R., and Kang X.T.. 2012. Polymorphisms of the interleukin-15 gene and their associations with fatness and muscle fiber traits in chickens. J. Appl. Genet. 53:443–448. 10.1007/s13353-012-0111-3 [DOI] [PubMed] [Google Scholar]
- Mack, M.R., Brestoff J.R., Berrien-Elliott M.M., Trier A.M., Yang T.B., McCullen M., Collins P.L., Niu H., Bodet N.D., Wagner J.A., et al. 2020. Blood natural killer cell deficiency reveals an immunotherapy strategy for atopic dermatitis. Sci. Transl. Med. 12:eaay1005. 10.1126/scitranslmed.aay1005 [DOI] [PMC free article] [PubMed] [Google Scholar]
- Maier, B., Leader A.M., Chen S.T., Tung N., Chang C., LeBerichel J., Chudnovskiy A., Maskey S., Walker L., Finnigan J.P., et al. 2020. A conserved dendritic-cell regulatory program limits antitumour immunity. Nature. 580:257–262. 10.1038/s41586-020-2134-y [DOI] [PMC free article] [PubMed] [Google Scholar]
- Mootha, V.K., Lindgren C.M., Eriksson K.F., Subramanian A., Sihag S., Lehar J., Puigserver P., Carlsson E., Ridderstråle M., Laurila E., et al. 2003. PGC-1alpha-responsive genes involved in oxidative phosphorylation are coordinately downregulated in human diabetes. Nat. Genet. 34:267–273. 10.1038/ng1180 [DOI] [PubMed] [Google Scholar]
- Ong, P.Y., Hamid Q.A., Travers J.B., Strickland I., Al Kerithy M., Boguniewicz M., and Leung D.Y.. 2002. Decreased IL-15 may contribute to elevated IgE and acute inflammation in atopic dermatitis. J. Immunol. 168:505–510. 10.4049/jimmunol.168.1.505 [DOI] [PubMed] [Google Scholar]
- Picelli, S., Faridani O.R., Björklund Å.K., Winberg G., Sagasser S., and Sandberg R.. 2014. Full-length RNA-seq from single cells using Smart-seq2. Nat. Protoc. 9(1):171–181. 10.1038/nprot.2014.006 [DOI] [PubMed] [Google Scholar]
- Popescu, D.-M., and Goh I.. 2021. Human Cell Atlas Developmental. A single cell atlas of adult healthy, psoriatic and atopic dermatitis skin.https://developmentcellatlas.ncl.ac.uk/datasets/hca_skin_portal/
- Reynolds, G., Vegh P., Fletcher J., Poyner E.F.M., Stephenson E., Goh I., Botting R.A., Huang N., Olabi B., Dubois A., et al. 2021. Developmental cell programs are co-opted in inflammatory skin disease. Science. 371:eaba6500. 10.1126/science.aba6500 [DOI] [PMC free article] [PubMed] [Google Scholar]
- Rückert, R., Asadullah K., Seifert M., Budagian V.M., Arnold R., Trombotto C., Paus R., and Bulfone-Paus S.. 2000. Inhibition of keratinocyte apoptosis by IL-15: a new parameter in the pathogenesis of psoriasis? J. Immunol. 165:2240–2250. 10.4049/jimmunol.165.4.2240 [DOI] [PubMed] [Google Scholar]
- Satpathy, A.T., Wu X., Albring J.C., and Murphy K.M.. 2012. Re(de)fining the dendritic cell lineage. Nat. Immunol. 13:1145–1154. 10.1038/ni.2467 [DOI] [PMC free article] [PubMed] [Google Scholar]
- See, P., Lum J., Chen J., and Ginhoux F.. 2018. A Single-Cell Sequencing Guide for Immunologists. Front. Immunol. 9:2425. 10.3389/fimmu.2018.02425 [DOI] [PMC free article] [PubMed] [Google Scholar]
- Seneschal, J., Clark R.A., Gehad A., Baecher-Allan C.M., and Kupper T.S.. 2012. Human epidermal Langerhans cells maintain immune homeostasis in skin by activating skin resident regulatory T cells. Immunity. 36:873–884. 10.1016/j.immuni.2012.03.018 [DOI] [PMC free article] [PubMed] [Google Scholar]
- Shi, C., and Pamer E.G.. 2011. Monocyte recruitment during infection and inflammation. Nat. Rev. Immunol. 11:762–774. 10.1038/nri3070 [DOI] [PMC free article] [PubMed] [Google Scholar]
- Stoeckius, M., Hafemeister C., Stephenson W., Houck-Loomis B., Chattopadhyay P.K., Swerdlow H., Satija R., and Smibert P.. 2017. Simultaneous epitope and transcriptome measurement in single cells. Nat. Methods. 14:865–868. 10.1038/nmeth.4380 [DOI] [PMC free article] [PubMed] [Google Scholar]
- Stuart, T., Butler A., Hoffman P., Hafemeister C., Papalexi E., Mauck W.M. III, Hao Y., Stoeckius M., Smibert P., and Satija R.. 2019. Comprehensive Integration of Single-Cell Data. Cell. 177:1888–1902.e21. 10.1016/j.cell.2019.05.031 [DOI] [PMC free article] [PubMed] [Google Scholar]
- Subramanian, A., Tamayo P., Mootha V.K., Mukherjee S., Ebert B.L., Gillette M.A., Paulovich A., Pomeroy S.L., Golub T.R., Lander E.S., and Mesirov J.P.. 2005. Gene set enrichment analysis: a knowledge-based approach for interpreting genome-wide expression profiles. Proc. Natl. Acad. Sci. USA. 102:15545–15550. 10.1073/pnas.0506580102 [DOI] [PMC free article] [PubMed] [Google Scholar]
- Tsai, Y.C., and Tsai T.F.. 2017. Anti-interleukin and interleukin therapies for psoriasis: current evidence and clinical usefulness. Ther. Adv. Musculoskelet. Dis. 9:277–294. 10.1177/1759720X17735756 [DOI] [PMC free article] [PubMed] [Google Scholar]
- Villani, A.C., Satija R., Reynolds G., Sarkizova S., Shekhar K., Fletcher J., Griesbeck M., Butler A., Zheng S., Lazo S., et al. 2017. Single-cell RNA-seq reveals new types of human blood dendritic cells, monocytes, and progenitors. Science. 356:eaah4573. 10.1126/science.aah4573 [DOI] [PMC free article] [PubMed] [Google Scholar]
- Xue, D., Tabib T., Morse C., and Lafyatis R.. 2020. Transcriptome landscape of myeloid cells in human skin reveals diversity, rare populations and putative DC progenitors. J. Dermatol. Sci. 97:41–49. 10.1016/j.jdermsci.2019.11.012 [DOI] [PubMed] [Google Scholar]
- Yin, X., Yu H., Jin X., Li J., Guo H., Shi Q., Yin Z., Xu Y., Wang X., Liu R., et al. 2017. Human Blood CD1c+ Dendritic Cells Encompass CD5high and CD5low Subsets That Differ Significantly in Phenotype, Gene Expression, and Functions. J. Immunol. 198:1553–1564. 10.4049/jimmunol.1600193 [DOI] [PubMed] [Google Scholar]
- Yu, B.L., Zhao S.P., and Hu J.R.. 2010. Cholesterol imbalance in adipocytes: a possible mechanism of adipocytes dysfunction in obesity. Obes. Rev. 11:560–567. 10.1111/j.1467-789X.2009.00699.x [DOI] [PubMed] [Google Scholar]
- Zhang, M.Y., Fang S., Gao H., Zhang X., Gu D., Liu Y., Wan J., and Xie J.. 2021. A critical role of AREG for bleomycin-induced skin fibrosis. Cell Biosci. 11:40. 10.1186/s13578-021-00553-0 [DOI] [PMC free article] [PubMed] [Google Scholar]
- Zhou, L.J., and Tedder T.F.. 1995. Human blood dendritic cells selectively express CD83, a member of the immunoglobulin superfamily. J. Immunol. 154:3821–3835. [PubMed] [Google Scholar]
- Zhou, Y., Zhou B., Pache L., Chang M., Khodabakhshi A.H., Tanaseichuk O., Benner C., and Chanda S.K.. 2019. Metascape provides a biologist-oriented resource for the analysis of systems-level datasets. Nat. Commun. 10:1523. 10.1038/s41467-019-09234-6 [DOI] [PMC free article] [PubMed] [Google Scholar]
- Zilionis, R., Engblom C., Pfirschke C., Savova V., Zemmour D., Saatcioglu H.D., Krishnan I., Maroni G., Meyerovitz C.V., Kerwin C.M., et al. 2019. Single-Cell Transcriptomics of Human and Mouse Lung Cancers Reveals Conserved Myeloid Populations across Individuals and Species. Immunity. 50:1317–1334.e10. 10.1016/j.immuni.2019.03.009 [DOI] [PMC free article] [PubMed] [Google Scholar]
Associated Data
This section collects any data citations, data availability statements, or supplementary materials included in this article.
Data Citations
- Popescu, D.-M., and Goh I.. 2021. Human Cell Atlas Developmental. A single cell atlas of adult healthy, psoriatic and atopic dermatitis skin.https://developmentcellatlas.ncl.ac.uk/datasets/hca_skin_portal/
Supplementary Materials
shows patient information. Table S1 a shows patient information of scRNA-seq and flow cytometry analysis. Table S1 b shows details of patients for scRNA-seq analysis. Table S1 c shows a comparison of the three datasets.


