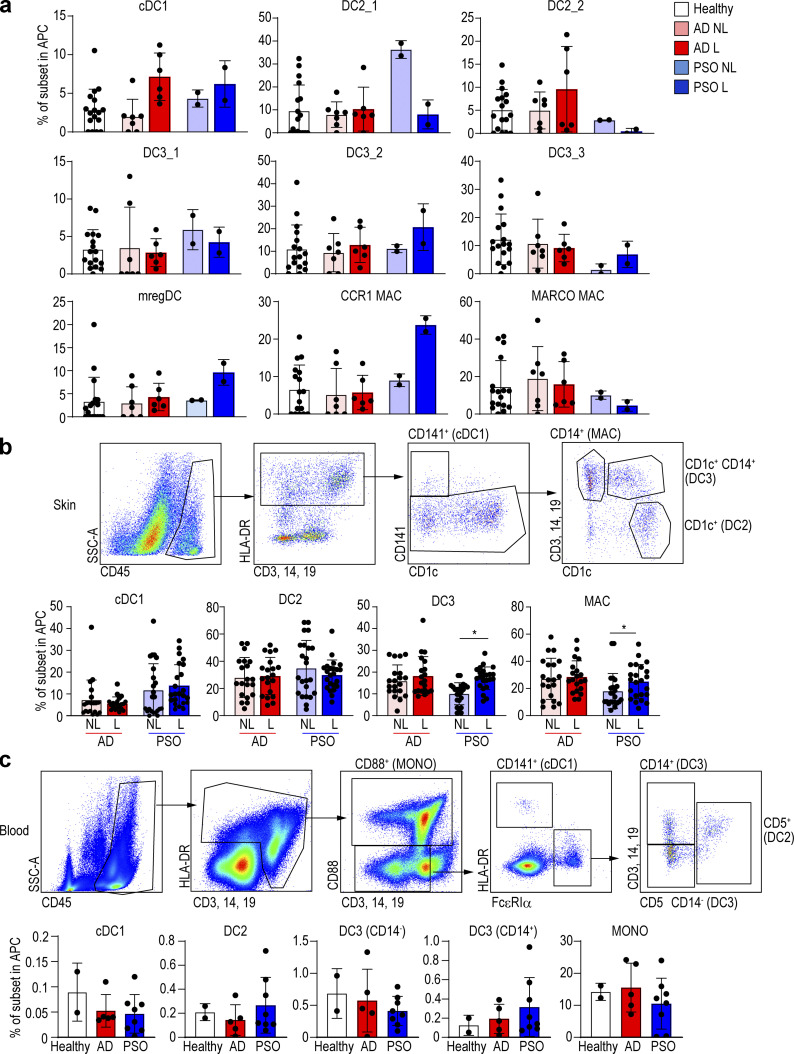
Figure 3.
CD14+ DC and macrophage (MAC) subsets of skin and blood in healthy, AD, and PSO samples.(a) Bar graph of the percentage of each DC and macrophage subset in healthy, nonlesional (NL), and lesional (L) skin from integrated scRNA-seq data. (b and c) Flow-cytometric analysis of each DC and macrophage in (b) skin and (c) blood of healthy subjects and AD (14 skin and 5 blood) and PSO (16 skin and 8 blood) patients. Top: Dot plot of flow cytometry. Bottom: Bar graph of the percentage of each DC and macrophage sub-population. P values were obtained by Wilcoxon matched-pairs signed-rank test (b) and Dunn’s multiple comparisons test (c). *, P ≤ 0.05. MAC, macrophage; MONO, monocyte.

