Figure 5.
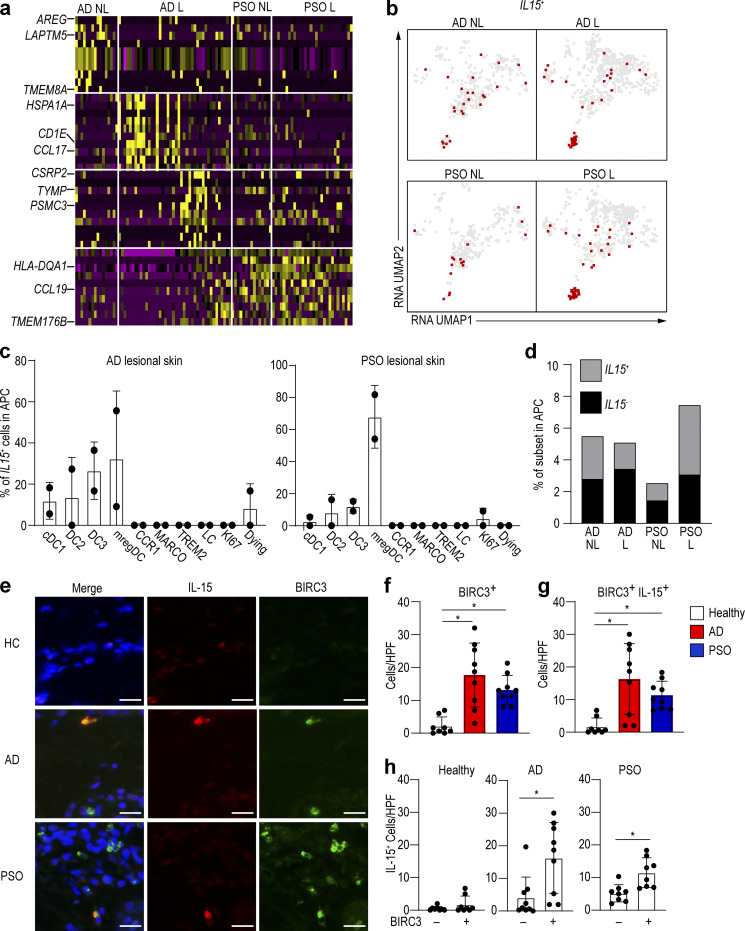
mregDCs produce IL-15 and are more abundant in AD skin.(a) Heat map comparing relative gene expression of mregDC in AD and PSO nonlesional (NL) and lesional (L) skin in our data. (b) Cells expressing IL15 were plotted onto the integrated UMAP of our data. (c) Percentage of IL15-producing cells in lesional skin from AD and PSO in our data. (d) Proportion of IL15-producing cells in AD and PSO skin. (e–h) Immunolabeling for IL-15 and BIRC3 in normal (n = 8), AD (n = 9), and PSO (n = 9) skin. Blue: DAPI, red: IL-15, green: BIRC3. Scale bar = 20 µm. (f–h) Bar graph of the number of BIRC3 (f), BIRC3/IL-15 (g), and IL-15 (h)–positive cells per high-power field (HPF; ×40) of view in healthy, AD, and PSO skin. P values were obtained by Dunn’s multiple comparisons test (f and g) and Mann–Whitney test (h). *, P ≤ 0.05. HC, healthy control.

