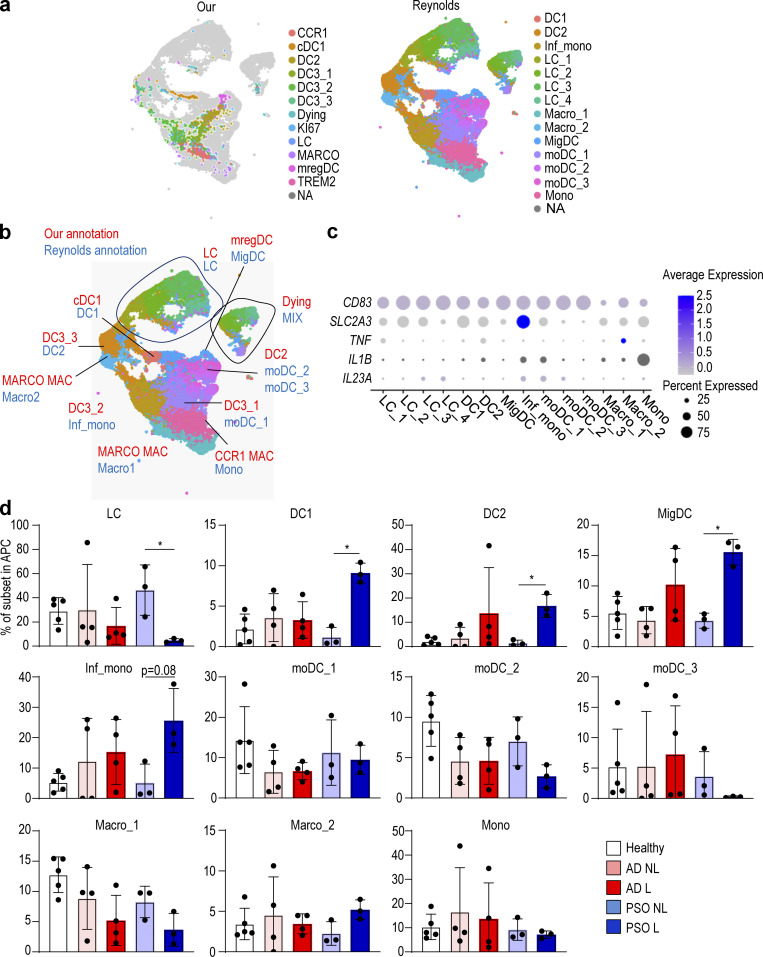
Figure 7.
In the Reynolds et al. (2021) dataset, DC3s produce IL1B and IL23A in PSO lesional skin.(a) UMAP visualization of APC integration of our dataset and the dataset from Reynolds et al. (2021). (b) Comparison of annotations between our dataset and the datasets from Reynolds et al. (2021). (c) Dot plot of IL1B, IL23A, and surface antigen expression in each cell subsets in the dataset from Reynolds et al. (2021). (d) Bar graph showing the percentage of each DC and macrophage (Mac) subset in healthy, nonlesional (NL), and lesional (L) skin from the dataset from Reynolds et al. (2021). P values were obtained by Kruskal–Wallis test (d). *, P ≤ 0.05. Mac, macrophage; Inf., inflammatory; LC, Langerhans cell; Mono mac, monocyte-derived macrophage; Mig., migratory; MoDC, monocyte-derived dendritic cell; Mono, monocyte.

