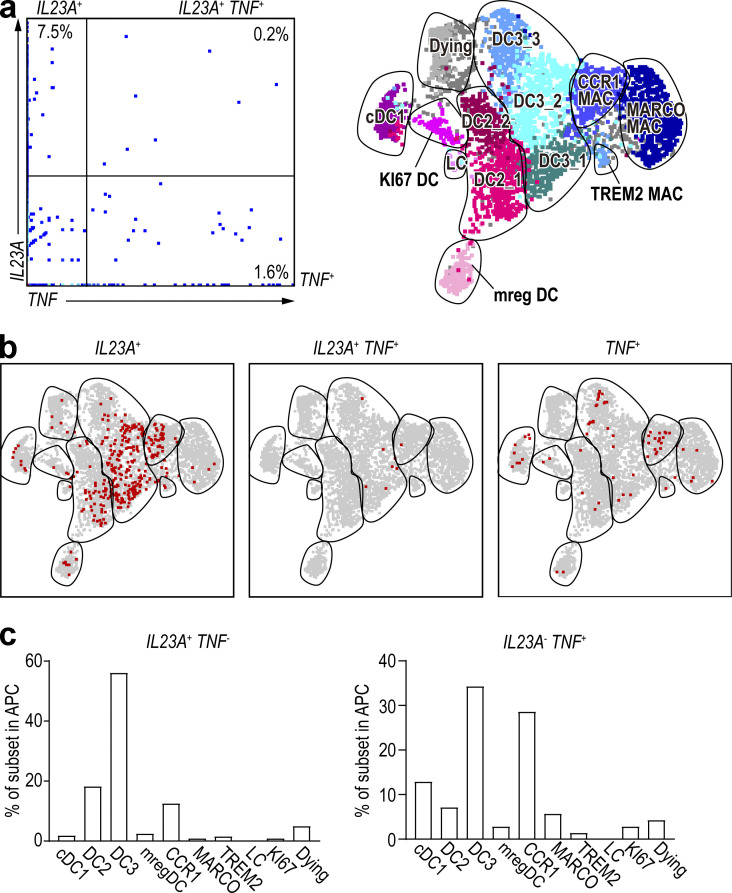
Figure S4.
TNF-producing cells and IL23A-producing cells are different.(a) Dot-plots of RNA expression of all cells of the integrated dataset. (b) IL23A-, IL23A/TNF double-, and TNF-positive cells were overlaid on UMAP, respectively. (c) Bar graph showing percentage of IL23A and TNF single-positive cells within each DC and macrophage (MAC) subset. LC, Langarhans cell.

