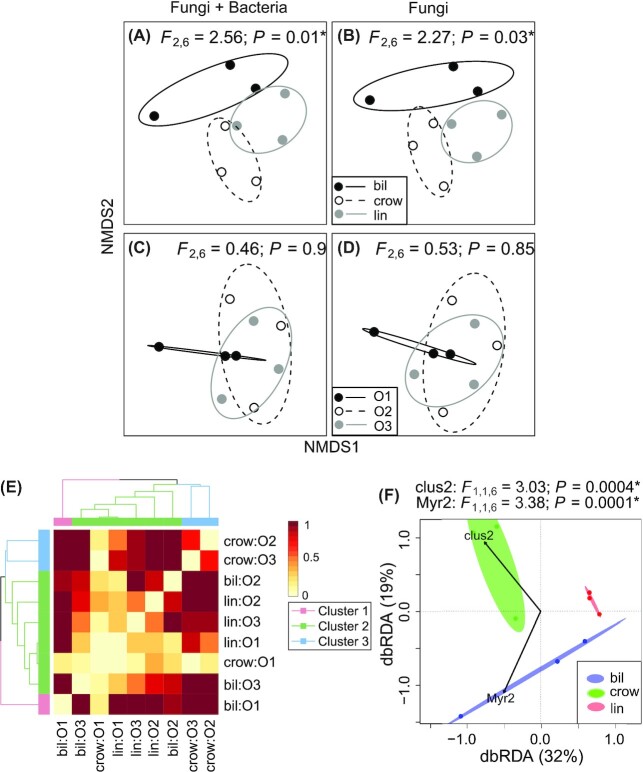
Figure 3.
Nonmetric multidimensional scaling (NMDS) ordinations of endophytic community compositions grouped by berry species (A and B), growth sites (C and D), an UPGMA tree (E) representing the similarity of the endophytic diversity of the samples, and a dbRDA plot (F) visualizing the most important collinearity-removal phenolic variables explaining the endophytic community assemblages. (A–D and F) Ellipses denote 95% confidence intervals around the group centroid based on standard errors. (*) indicates the significance in the statistical tests. Abbreviations: bil – bilberry, crow – crowberry, lin – lingonberry and growth sites (O1, O2 and O3).

