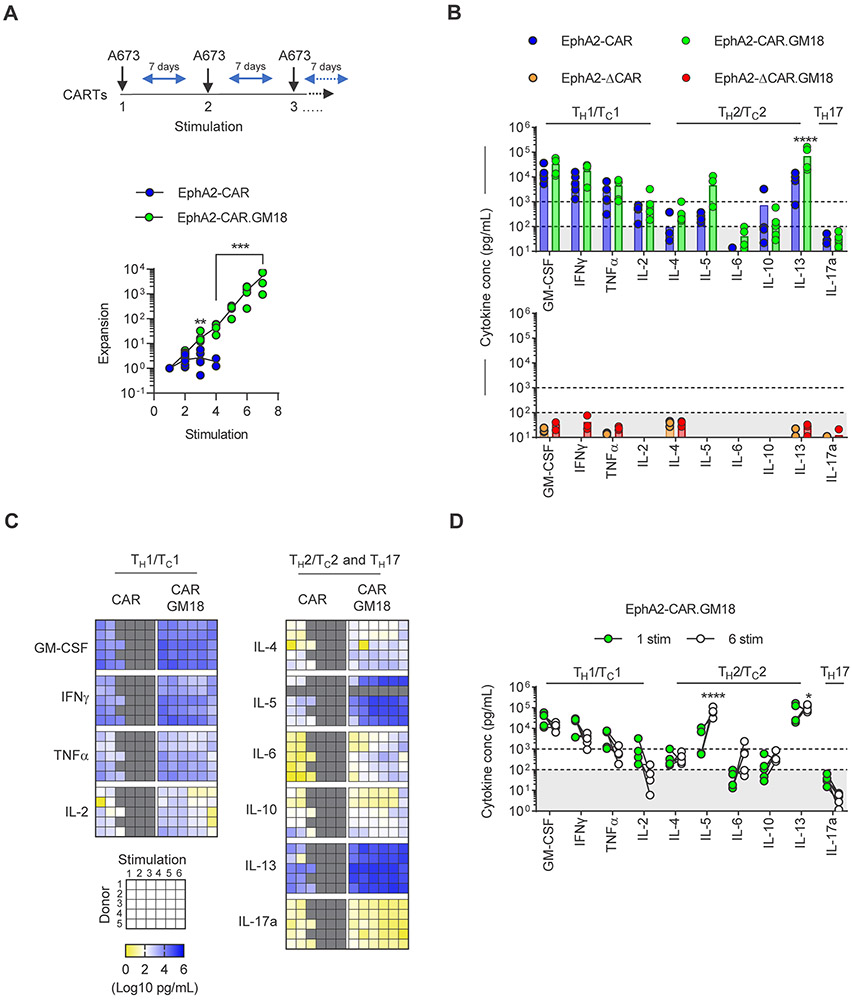
Figure 2: EphA2-CAR.GM18 T-cells have improved effector function after chronic antigen exposure in vitro.
(A) CAR T-cell expansion following serial coculture with fresh A673 tumor cells weekly. Fold expansion of EphA2-CAR and EphA2-CAR.GM18 T-cells; N=6, **p=0.0023, **p=0.0001, paired t-test. (B) Cytokine production by CAR T-cells after one stimulation with A673 tumor cells at 2:1 E:T ratio measured by multiplex analysis: EphA2-CAR (N=5), EphA2-CAR.GM18 (N=5), EphA2-ΔCAR (N=3), and EphA2-ΔCAR.GM18 (N=3). (C) Multiplex analysis of cytokine production of CAR T-cells after 48 hours of weekly restimulation with A673 cells at 2:1 E:T ratio. IL-5: N=4, all other cytokines N=5; sorted CAR and CAR.GM18 T-cells (N=4); unsorted CAR and CAR.GM18 T-cells (N=1); double gradient heatmap (yellow: 100 pg/mL, white: 102 pg/mL, blue 106 pg/mL). (D) Comparison of cytokine secretion between the first and sixth stimulation of EphA2-CAR.GM18 T-cells from panel C. *p=0.023, ****p<0.0001; two-way ANOVA. For all panels, N indicate different donors.

