
Figure 1. The distribution of mean temperature and PM2.5 exposures over gestation.
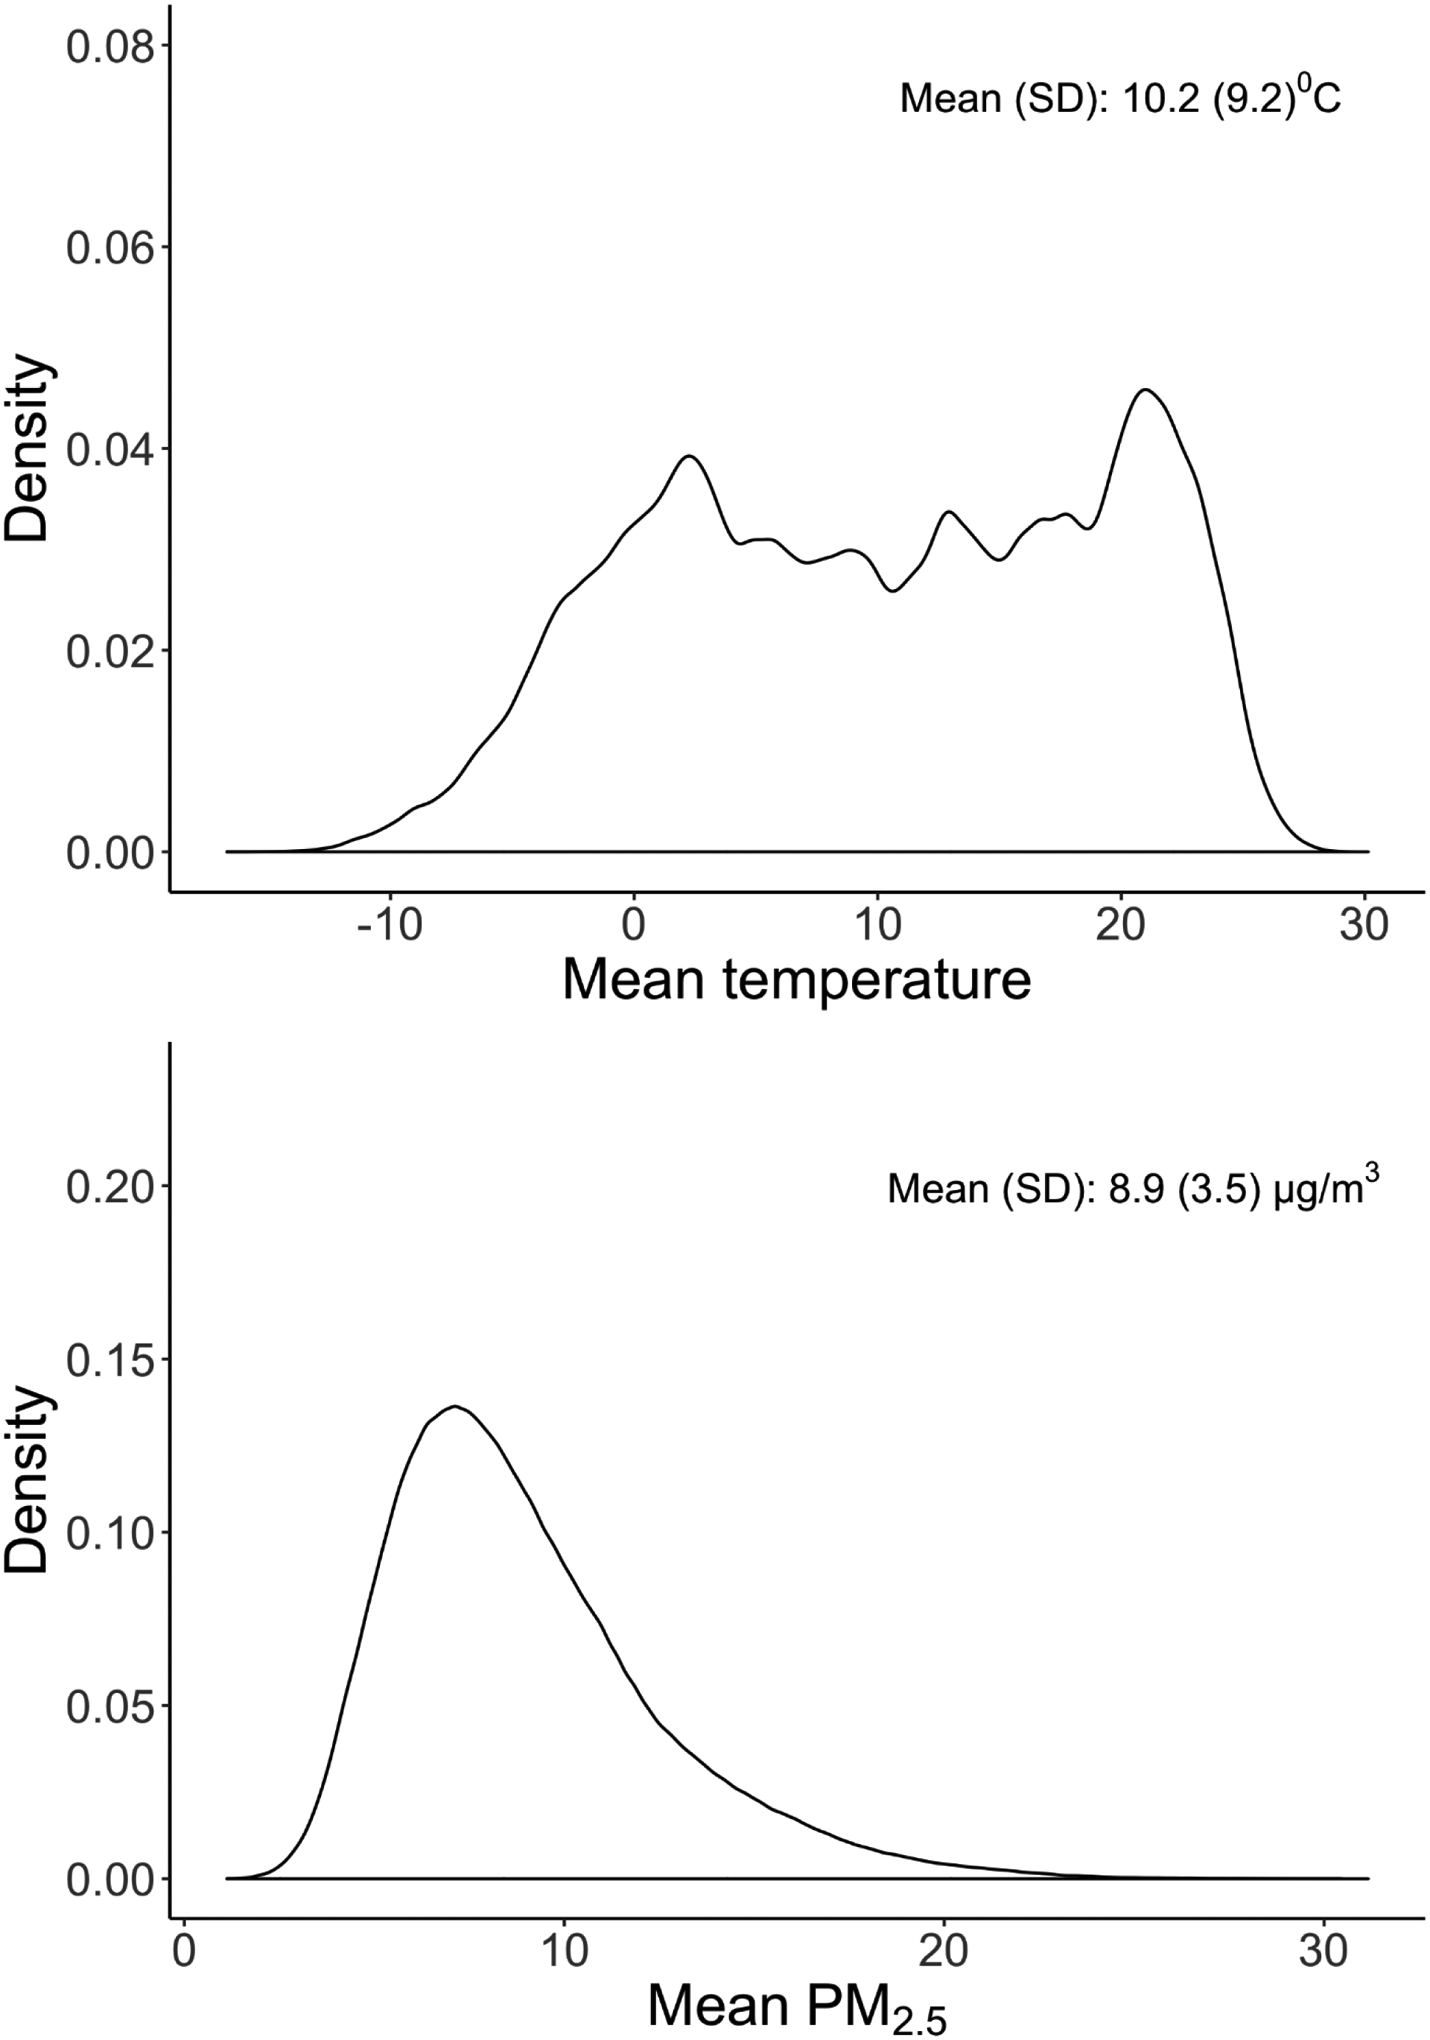
Figure 1 shows the distribution of weekly temperature and PM2.5 exposures. Each woman contributed 37 weeks of weekly averaged exposures.
Official websites use .gov
A
.gov website belongs to an official
government organization in the United States.
Secure .gov websites use HTTPS
A lock (
) or https:// means you've safely
connected to the .gov website. Share sensitive
information only on official, secure websites.
Figure 1 shows the distribution of weekly temperature and PM2.5 exposures. Each woman contributed 37 weeks of weekly averaged exposures.