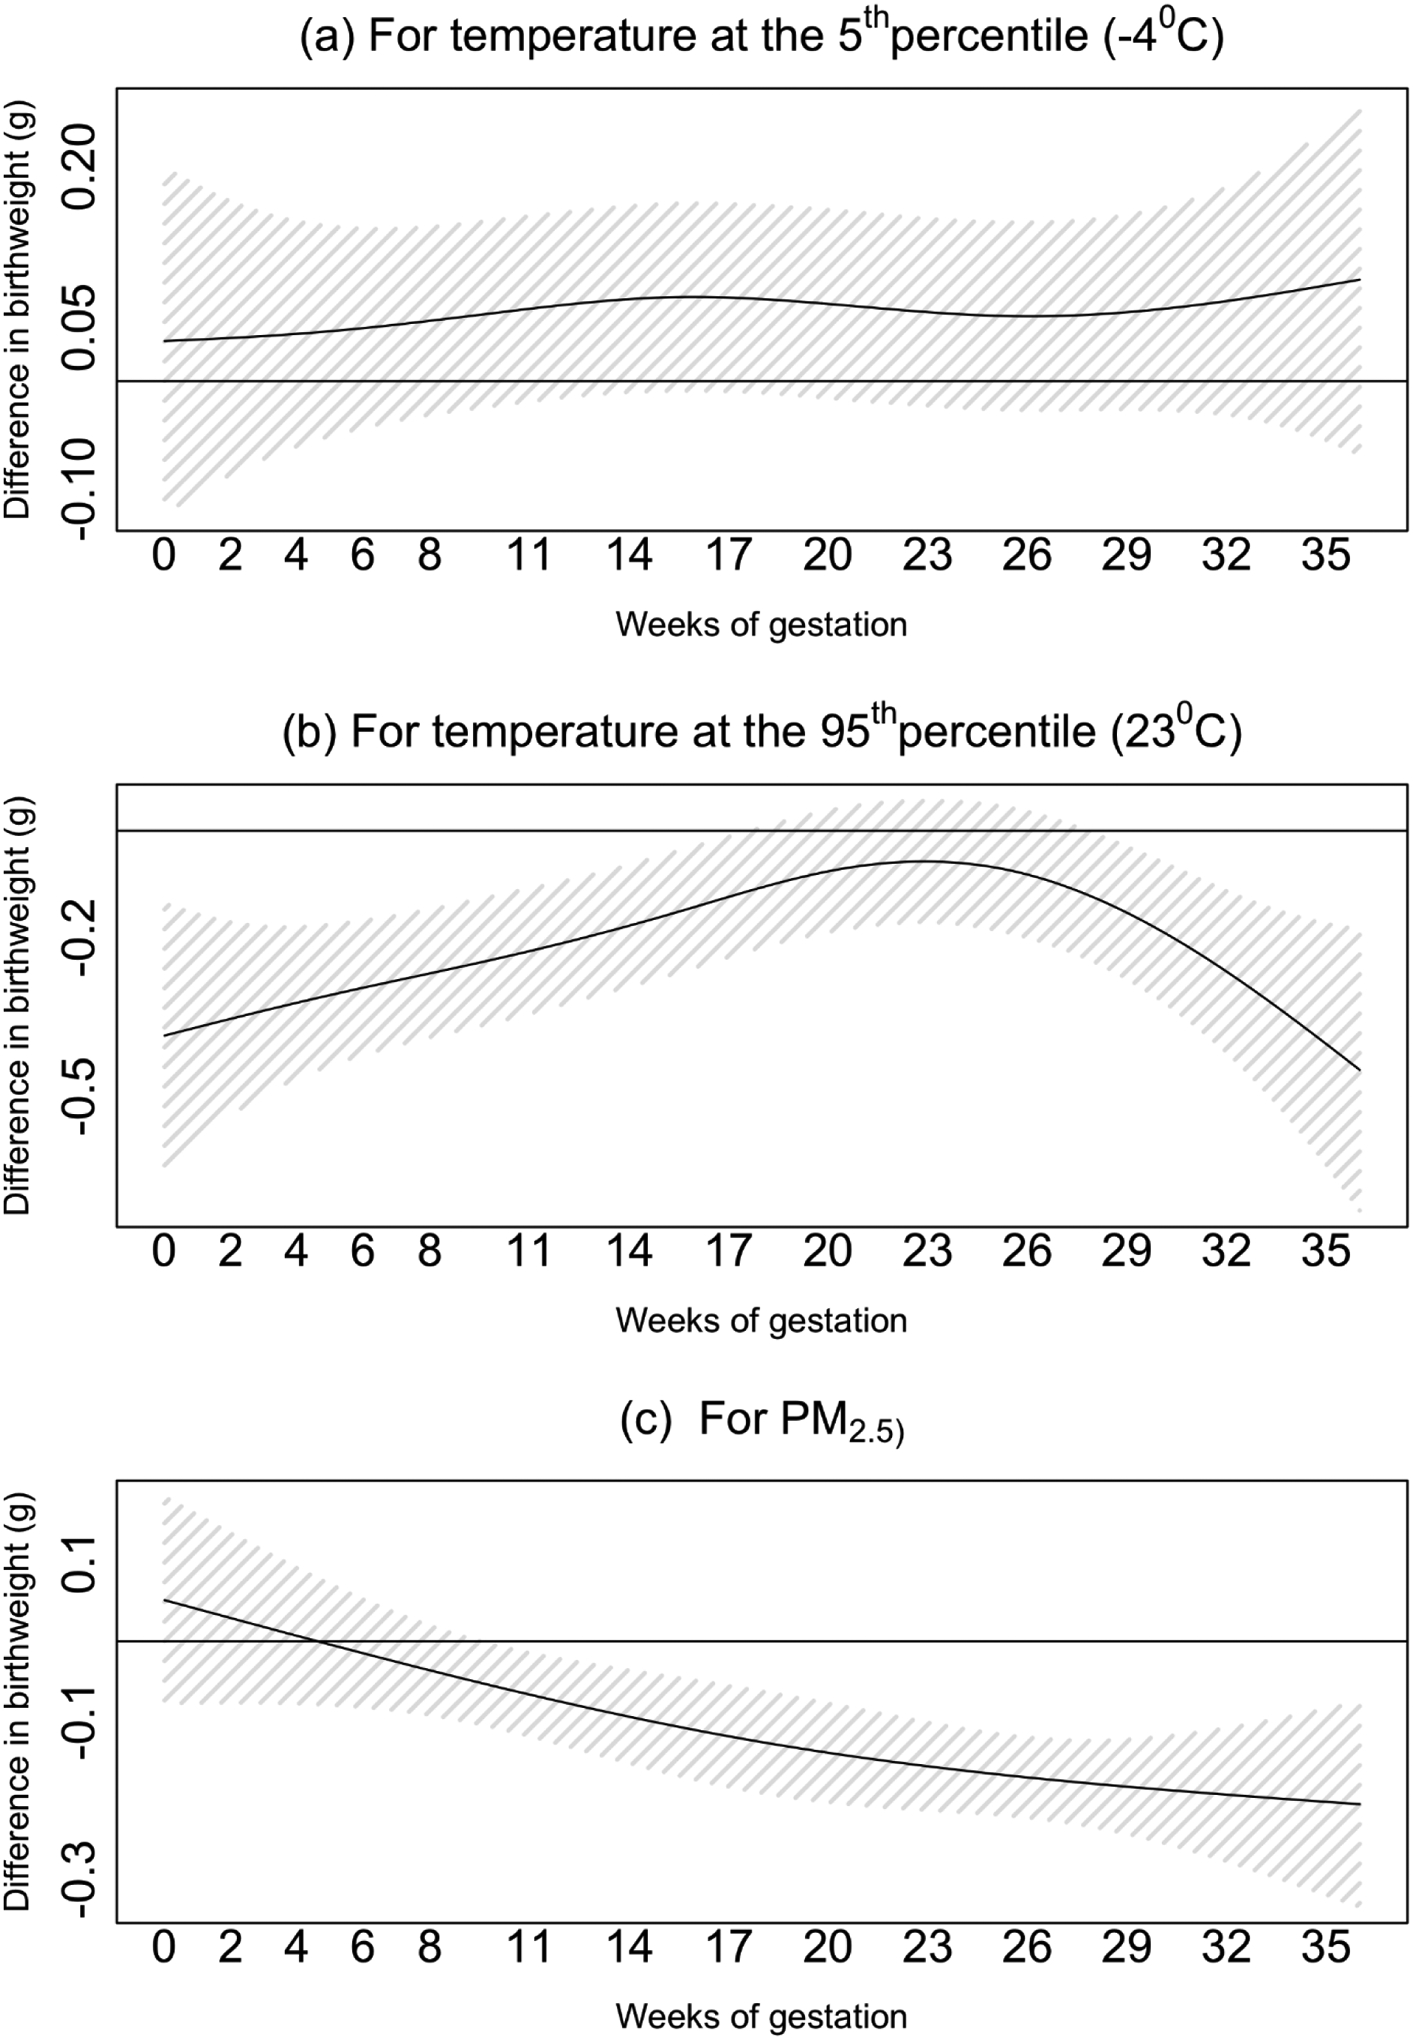
Figure 3. The difference in birth weight for temperature at the 5th percentile (−4 °C) (a), temperature at the 95th percentile (23 °C) (b), and PM2.5 exposure (c) across the different weeks of gestation.

The model is adjusted for: season and year of birth, a cyclic spline of day of the year, government support for prenatal care, race, age of mother at birth, parity, maternal smoking before or during pregnancy, the maternal highest level of education attained, chronic diabetes, chronic hypertension, gestational age at birth, and census block-group socioeconomic characteristics (i.e., population density and median household income).
