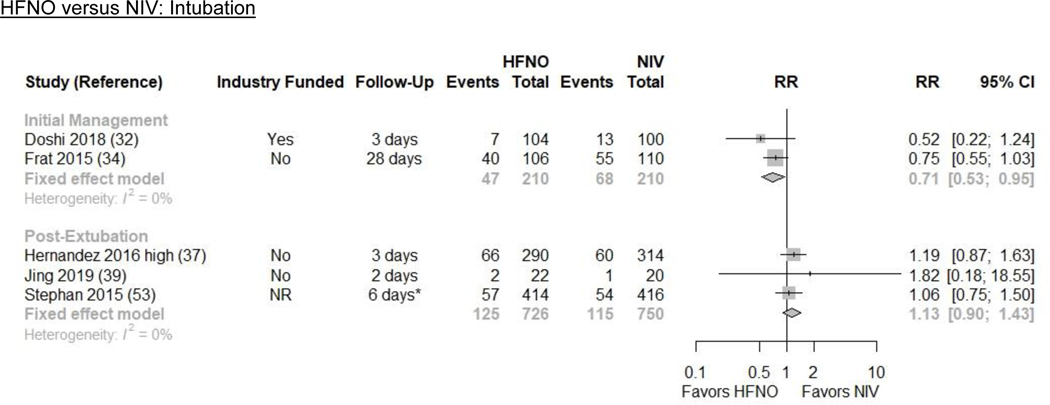
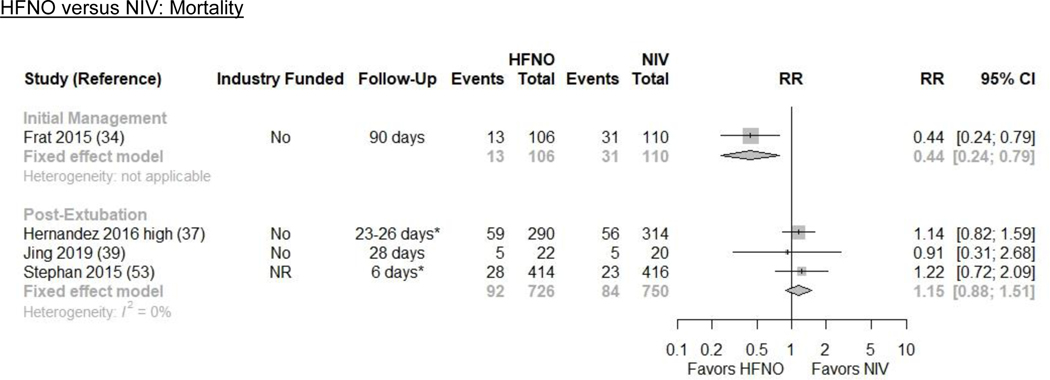
Figure 2. Intubation and Mortality Plots for HFNO versus NIV.
CI=confidence interval; HFNO=high-flow nasal oxygen; ICU=intensive care unit; NIV=non-invasive ventilation; RR=risk ratio
*This is an estimated follow-up time based on the reported median ICU length of stay.
CI=confidence interval; HFNO=high-flow nasal oxygen; ICU=intensive care unit; NIV=non-invasive ventilation; RR=risk ratio*These are estimated follow-up times based on the reported median hospital or ICU length of stay.


