
Figure 4. Quantification of TOMM70a and TH proteins in the striatum of normal and DRD mice.
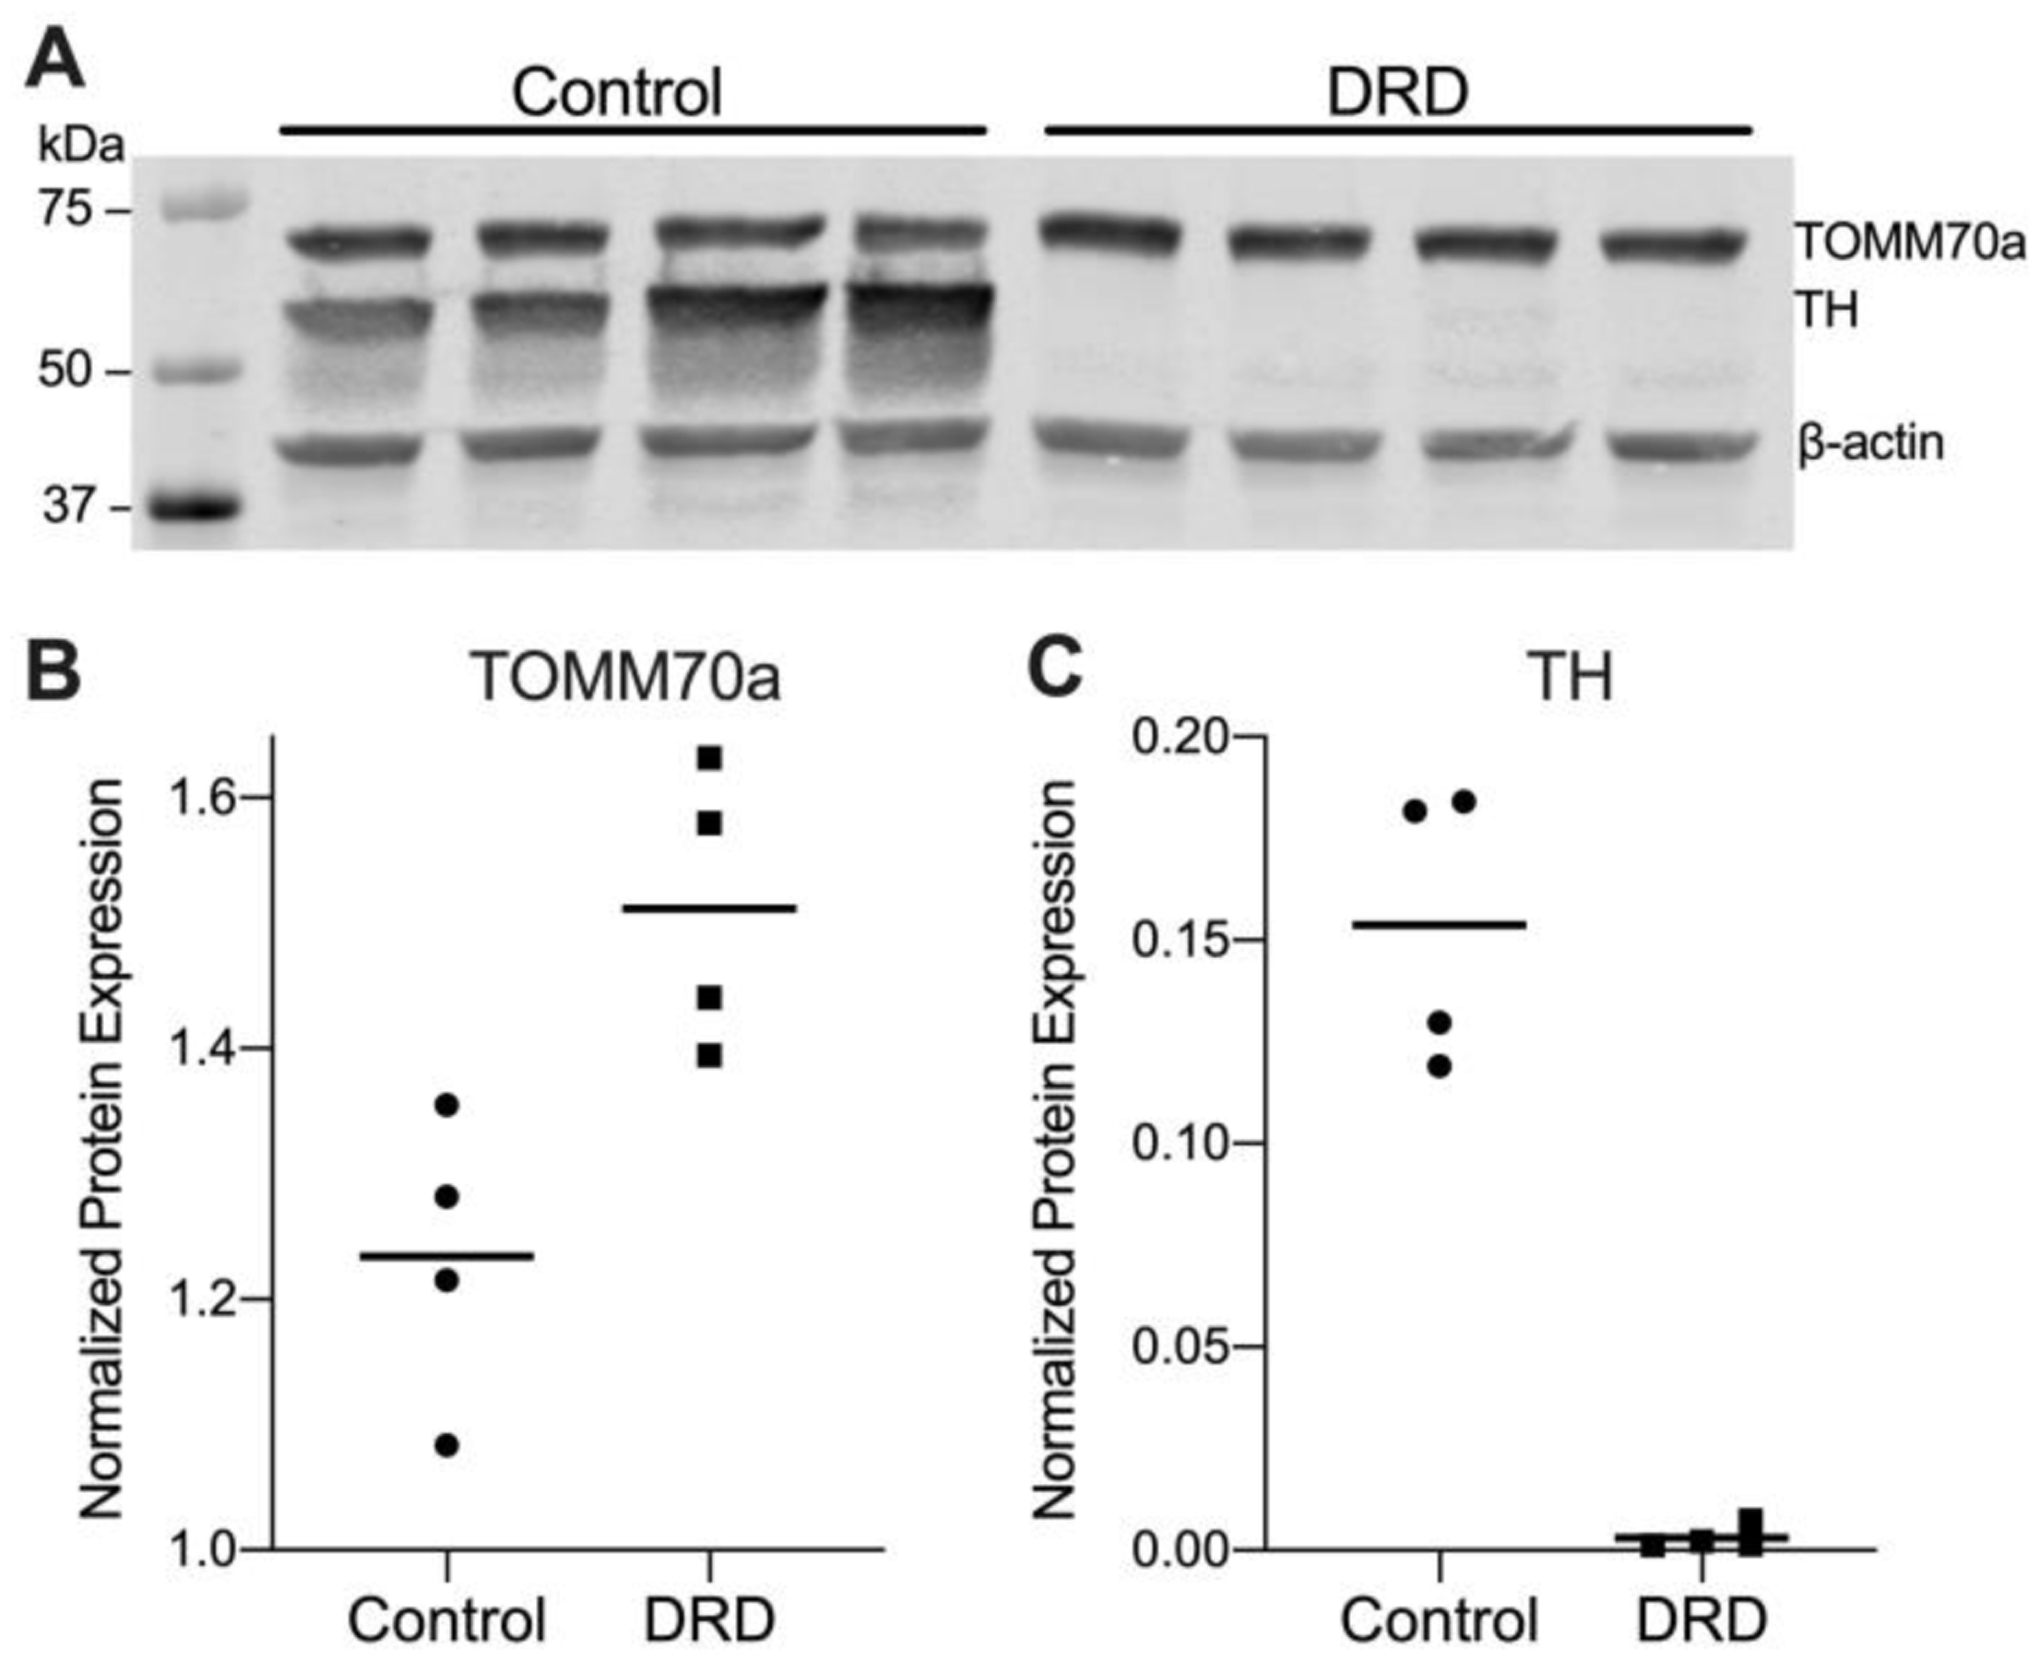
A. Western blot for TOMM70a, TH. ß-actin was used as a loading control. Each lane represents an individual mouse. The molecular weight standard is shown in the left lane. B. TOMM70a protein expression was significantly increased in DRD mice compared to control mice (Student’s two-tailed t-test, p = 0.014). C. TH protein expression was significantly reduced in DRD mice compared to control mice (Student’s two-tailed t-test, p = 0.0001). B and C illustrate means (horizontal lines) and individual values of the densitometric quantification of TOMM70a and TH which was normalized to ß-actin.