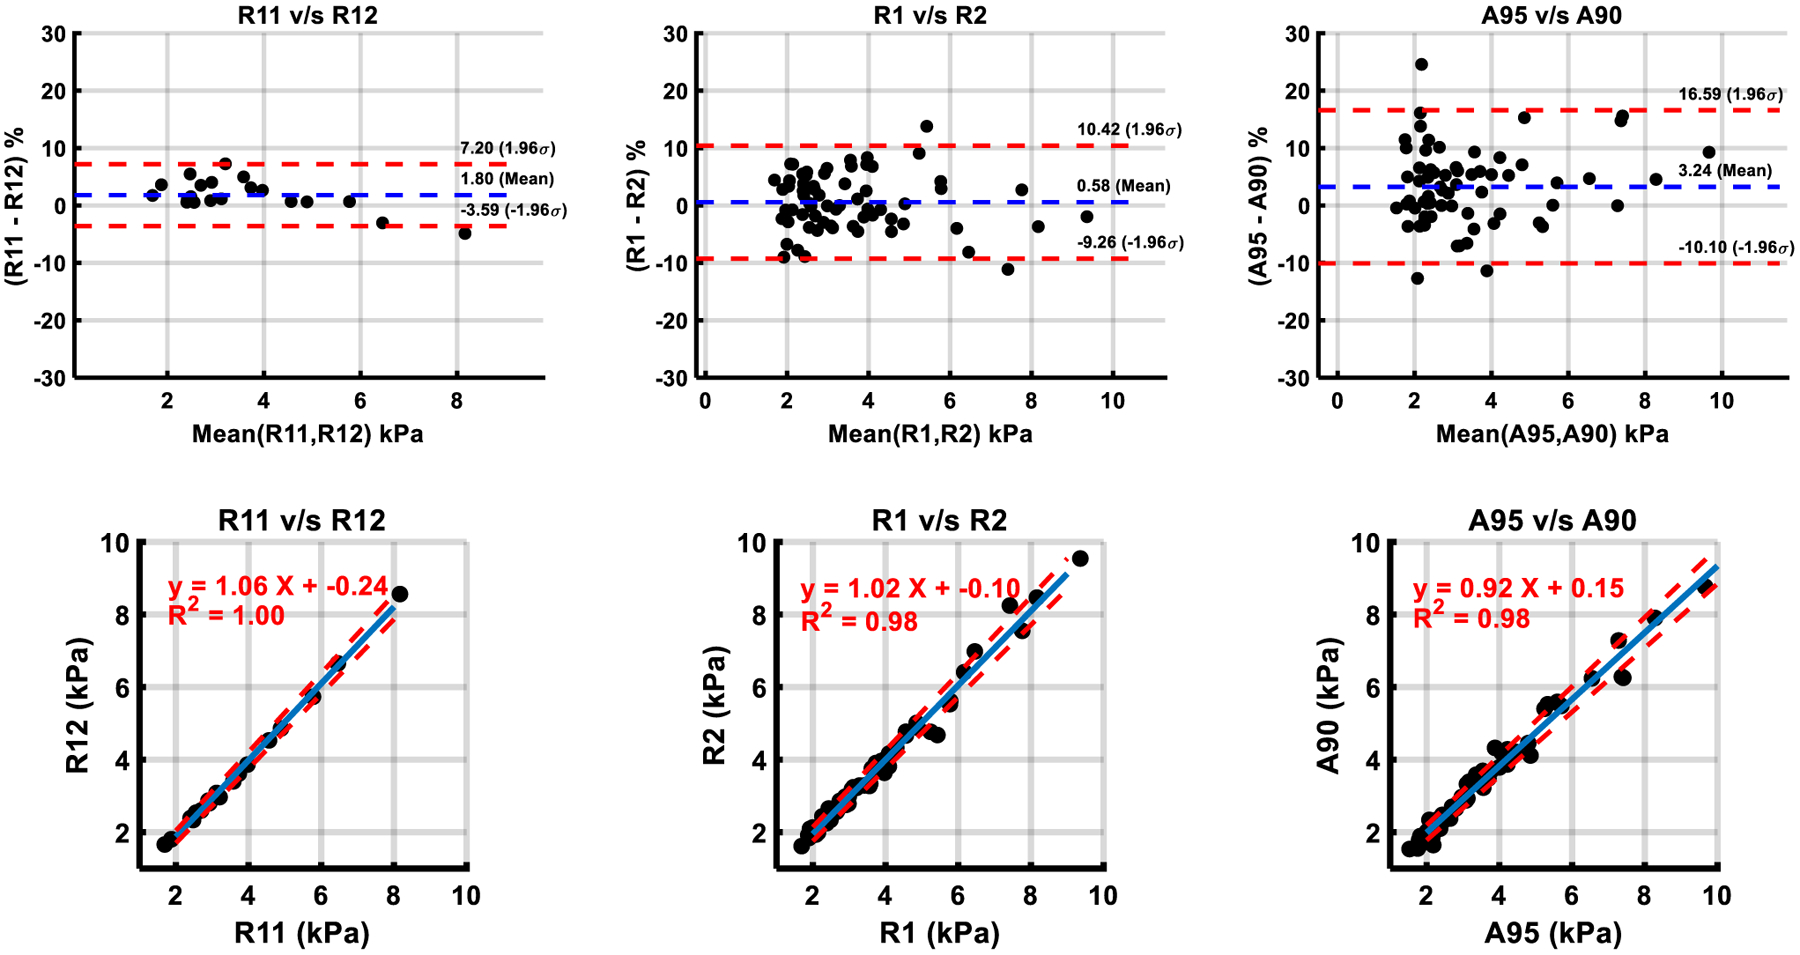
Fig. 2.

Comparison of shear stiffness measurements within manual and automated methods by Bland–Altman analysis and Linear Regression. Manual analysis informed by a 95% confidence mask by Reader 1 (R1) and Reader 2 (R2). Automated analysis using a 95% confidence mask (A95) and a 90% confidence mask (A90). Intra-reader comparison for a 95% confidence mask in 20 subjects using Reader 1’s initial set of contours (R1,1) and his repeat contours (R1,2). In scatter plots, blue line—list squares fit, dotted red line—95% confidence interval
