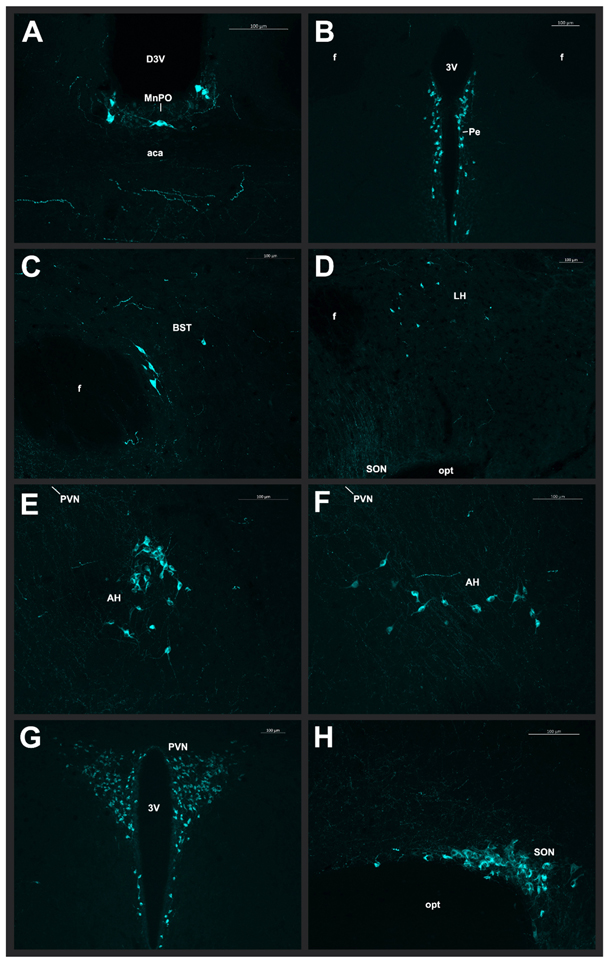
Fig. 6 – Photomicrographs of oxytocin-immunoreactive cells:
Representative photomicrographs from a male spiny mouse of OT-ir cells in the (A) MnPO (20x magnification), (B) Pe (10x magnification), (C) BST (20x magnification), (D) LH (10x magnification), (E) rostral AH (20x magnification), (F) caudal AH (20x magnification), (G) PVN (10x magnification), and (H) SON (20x magnification). Images were pseudocolored cyan.

