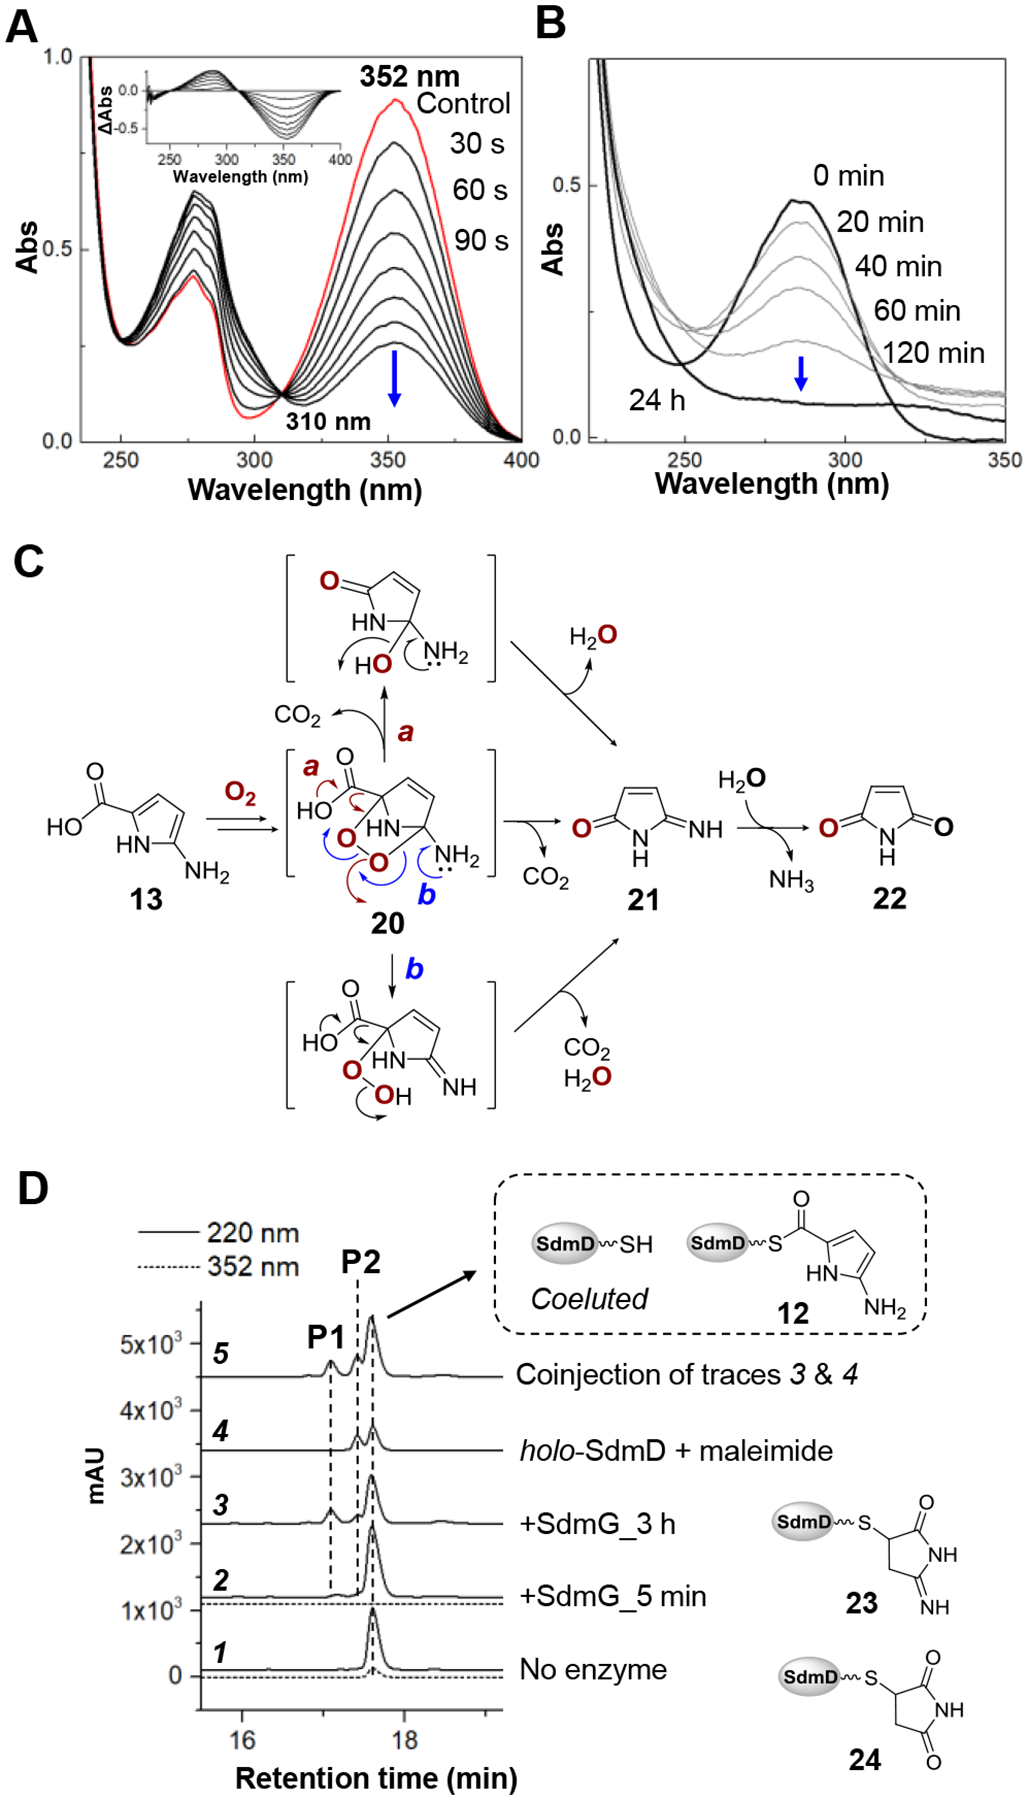
Figure 4.

(A) Time-course of the SdmG-catalyzed reaction monitored by UV-Vis spectroscopy. The final enzyme and substrate concentrations were 50 nM and 30 μM, respectively. The inset shows difference spectra calculated by subtracting the spectrum of a control with no SdmG from each time-point. (B) Decomposition of the SdmG product determined by the diminishing absorbance at 288 nm of the reaction filtrate over 24 h. (C) The proposed autoxidation of 13. Decomposition of the endoperoxide intermediate 20 to 21 and 22 may proceed via either direct decarboxylation (route a) or O-O bond cleavage triggered by imine formation (route b). (D) HPLC analysis of the proteinaceous products from the aerobic SdmG reaction. The elution was monitored at 352 nm (dash line) to determine the consumption of substrate 12.
