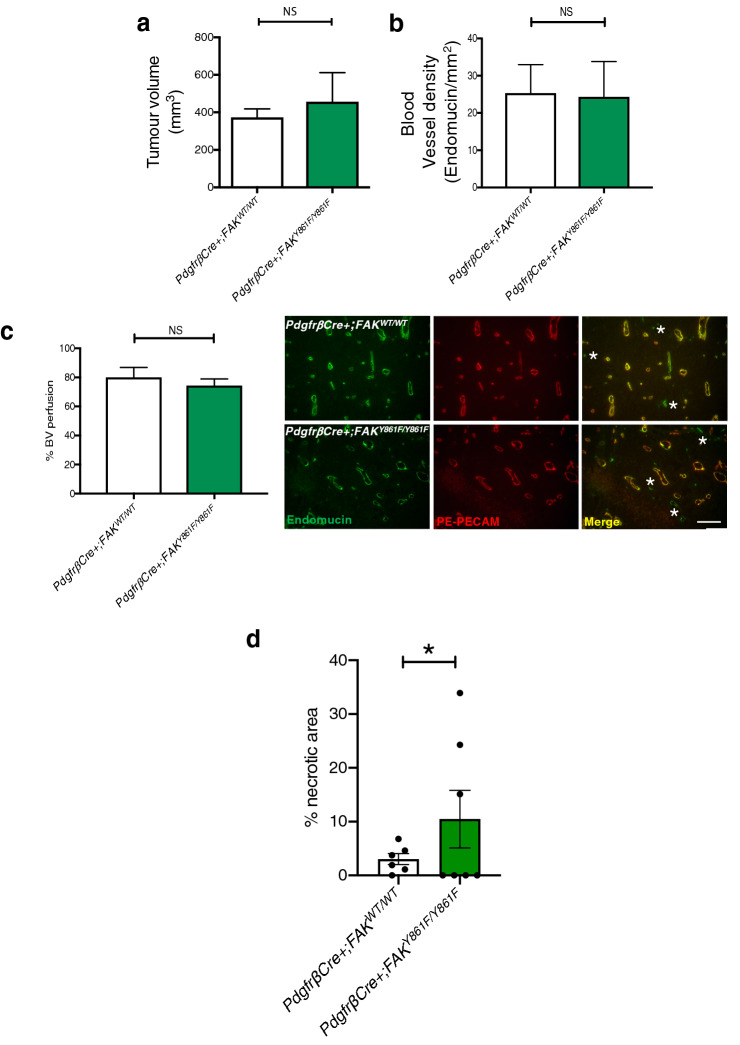
Fig. 3.
Early stage tumour growth is similar between PdgfrβCre + ;FAKWT/WT and PdgfrβCre + ;FAKY861F/Y861F mice. Early (day 12): a Tumour size, b Blood vessel density, and c Blood vessel perfusion were similar between PdgfrβCre + ;FAKWT/WT and PdgfrβCre + ;FAKY861F/Y861F mice. Bar charts represent mean + s.e.m.; ns, not significant. Student’s t-test. For a, n = 8 PdgfrβCre + ;FAKWT/WT mice, 5 PdgfrβCre + ;FAKY861F/Y861F mice. For b and c n = 8 PdgfrβCre + ;FAKWT/WT tumours, 5 PdgfrβCre + ;FAKY861F/Y861F tumours. Representative images showing blood vessel perfusion in LLC tumours from PdgfrβCre + ;FAKWT/WT and PdgfrβCre + ;FAKY861F/Y861F mice. Scale bar, 50 μm. Asterisks, non-perfused blood vessels. d Tumour necrosis was increased in PdgfrβCre + ;FAK Y861F/Y861F. Bar chart shows % necrotic area in tumours from PdgfrβCre + ;FAKWT/WT and PdgfrβCre + ;FAK Y861F/Y861Fmice.*P < 0.05 Wilcoxon test; n = 6 tumours from PdgfrβCre + ;FAKWT/WT mice and 7 tumours from PdgfrβCre + ;FAK Y861F/Y861F mice

