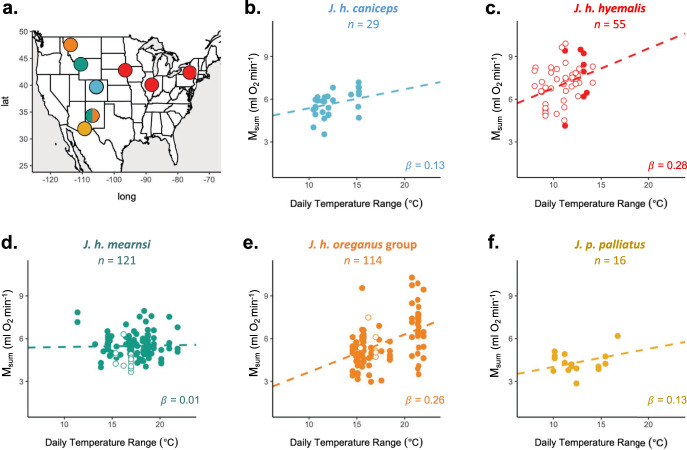
Fig. 1. Relationships between daily temperature range and thermogenic capacity (Msum) differ among five Junco taxa assayed in the field.
a Map of sampling sites for field measurements color-coded by taxon, following color scheme in b–f and plotted in R with package mapdata87. b–f Taxon-specific relationships between Msum and daily temperature range (averaged over the 8 days prior to capture), while controlling for differences in body mass. Each dot represents an individual (n = 335). Sample sizes for each taxon are listed at the top and the slope (β; in ml O2 min−1 °C−1) of each relationship is shown in the lower right corner. Sampling occurred during the breeding season (filled circle) or nonbreeding season (open circle). Lines fit from glm (Msum = Mb + Taxa × Td_range) using mean Mb for each taxon. Source data are provided in the Source Data file.

