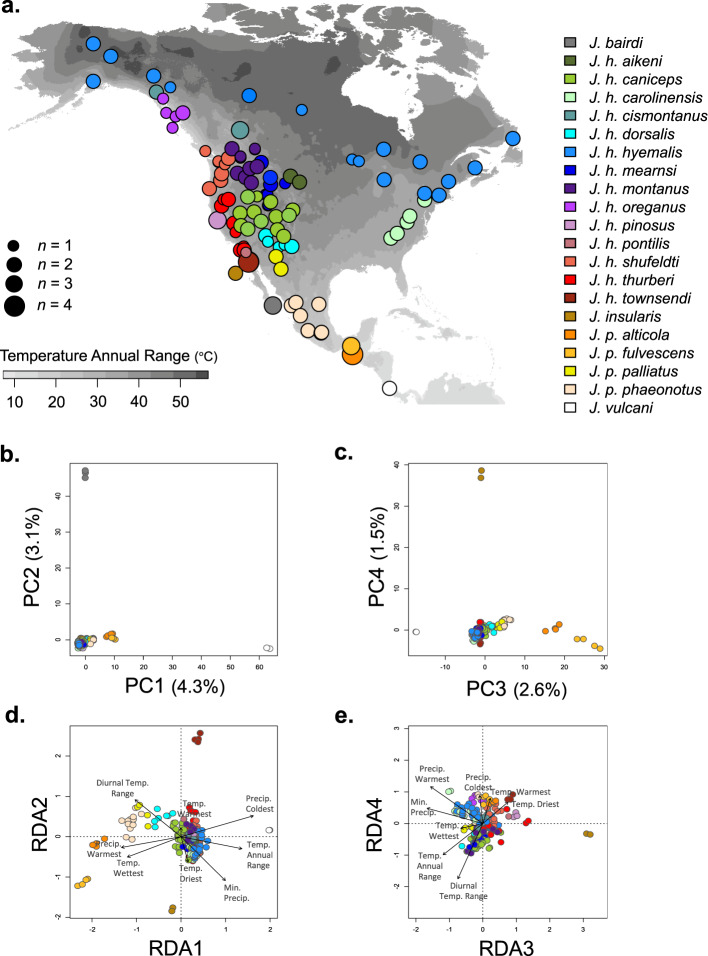
Fig. 2. Junco population genetic variation.
a Origin of 181 Junco individuals included in the SNP dataset. Map shading (in grayscale) depicts temperature annual range values from WorldClim66, plotted in R with package raster67. Dot color denotes museum-based taxon assignments; dot size represents the number of individuals from that locale (n = 1 to 4). Population genetic variation from 22,006 genome-wide SNPs structured along four PC axes (b, c) and four RDA axes (d, e) where each dot represents an individual. Colors follow the legend provided in (a). d, e Arrows indicate loadings of eight WorldClim variables (diurnal temperature range, temperature annual range, mean temperature of the warmest quarter, mean temperature of the wettest quarter, mean temperature of the driest quarter, mean minimum precipitation, mean precipitation of the warmest quarter, and mean precipitation of the coldest quarter) in a partial RDA conditioned on PC axes 1 and 2. Source data are provided in the Source Data file.

