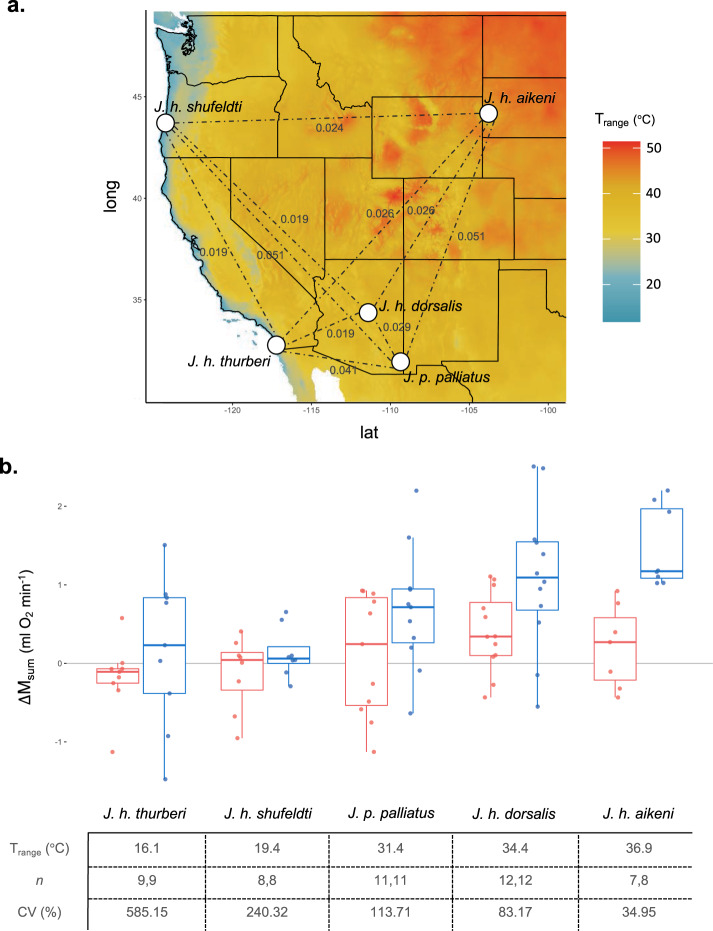
Fig. 3. Junco thermogenic flexibility correlates with thermal heterogeneity.
a Origin of five Junco populations used in laboratory acclimations (dots) that differ in their native annual temperature range (Trange; values from WorldClim66), shown in shaded colors and plotted in R with package raster67. Pairwise FST indicated by dotted lines and accompanying values in gray. b Thermogenic flexibility, measured as the change in Msum over the 3-week temperature acclimation treatment (post- minus pre-acclimation), for each population. Boxplots show the median values, the 25th and 75th percentiles (lower and upper margins of the box), and the minimum and maximum values ≤1.5 × IQR from the box margin (whiskers). Dots indicate individual measures (n = 95). Control birds (acclimated to 23 °C) in red; cold-acclimated birds (3 °C) in blue. For each population, the native Trange, number of individuals in each treatment (Control, Cold), and coefficient of variation for cold-acclimated individuals (CV) are shown below. Source data are provided in the Source Data file.

