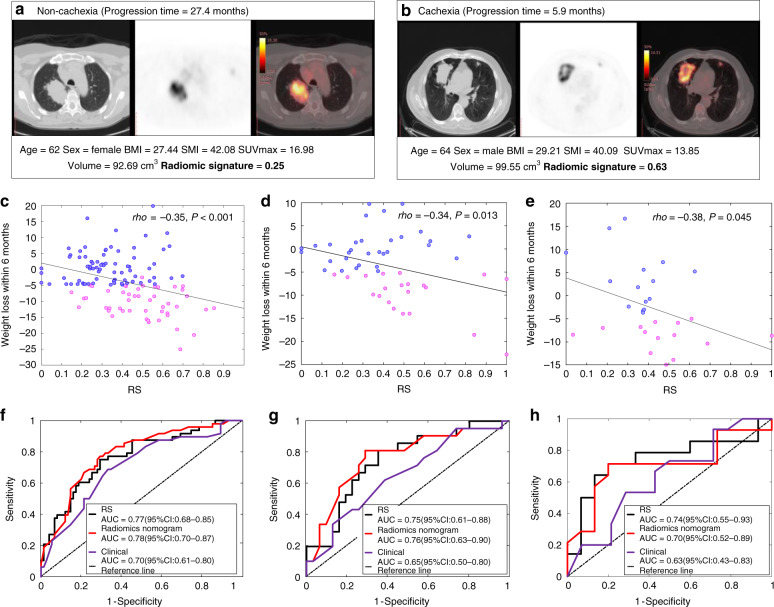
Fig. 2. Radiomics signatures of NSCLC patients and their diagnostic performance in various cohorts.
a, b The CT, PET and fusion images for a patient with NSCLC, together with the corresponding clinical variables and radiomics signatures. c–e The Pearson correlation between RS and the weight loss within 6 months since the start of the immunotherapy in the training, test and external test cohorts, respectively. P-value indicates two-sided Pearson correlation test. f–h The ROC curves of RS, radiomics nomogram and clinical models in the training, test and external test cohorts, respectively.

