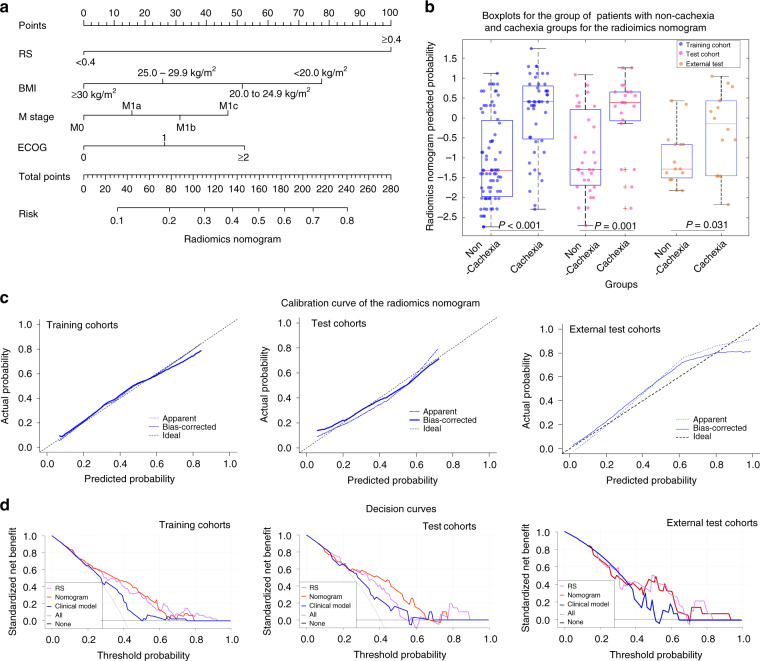
Fig. 3. Radiomics Nomograms.
a The nomogram constructed with RS and clinical variables to estimate the risk of cachexia. b The box plot of nomogram predicted cachexia probability of individual. In the boxplots, the central line represents the median, the bounds of box the first and third quartiles, and the whiskers are the interquartile range. The blue points represent the training cohort, the magenta points represent the test cohort, and the orange points represent the external test cohort. P-value shows two-sided Wilcoxon signed-rank test. c The assessment of the model calibration in the training, test and external test cohorts. d The decision curves of RS, radiomics nomogram and clinical model in the training and test cohorts.

