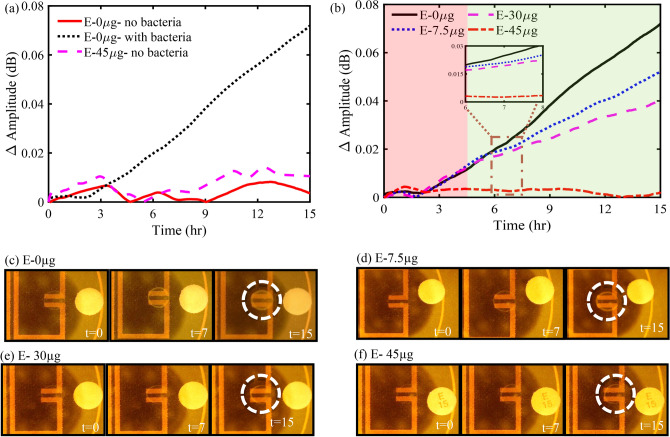
Figure 3.
(a) Impact of a blank paper disk (without antibiotics) with inoculated and un-inoculated agar samples, and a 45 µg erythromycin disk with inoculated agar sample on the response of the resonator. (b) ΔAmplitude (dB) vs time (hr) depicting the detectable (green) and undetectable (red) regions of bacterial growth, (c–f) microscope images, of 0, 7.5, 30, and 45 µg of erythromycin with bacterial growth or inhibition shown in the dotted white circle.

