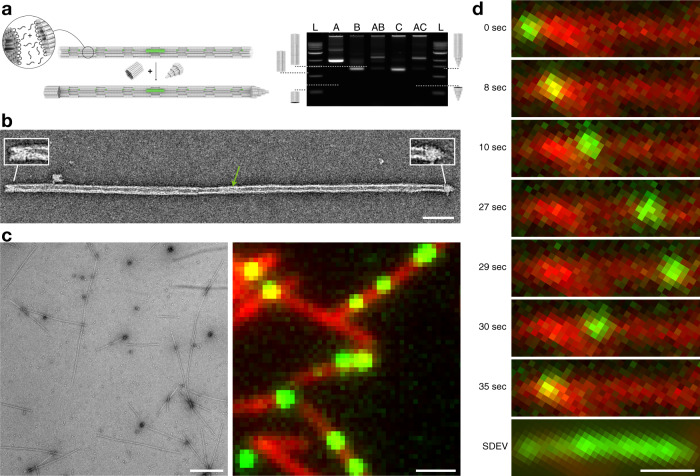
Fig. 3. Filament polymerization, capping, and single-particle imaging.
a Left: Schematic illustration of the polymerization reaction and subsequent capping of the filament ends. Filament polymerization is induced by addition of DNA oligonucleotides that bridge barrel monomer helical interfaces. Subsequently, capping objects are added to solution which feature single-stranded DNA overhangs complementary to barrel ends. Cap attachment quenches further polymerization. The piston (green object inside the filament) is now sterically trapped. Right: Laser-scanned image of an agarose gel (2%, 21 mM MgCl2, 90 V, 90 min, ice-water bath) on which the following samples were electrophoresed: L = 1 kb ladder, A = closed barrel, B = capping object, AB = closed barrel-capping object 1 dimers, C = closed barrel-capping object 1 dimers, C = capping object 2, AC = closed barrel-capping object 2 dimers. The total number of conducted gel-electrophoretic analyses of samples prepared following the same protocol as illustrated here (steps 10 and 11 in the transport system sample preparation protocol) was 3 times and showed similar results. b Exemplary negative-staining TEM image of a capped filament. Green arrow: piston. Insets highlight cap monomers. Scale bar: 100 nm. The total number of conducted TEM analyses of samples prepared following the same protocol as illustrated in the transport system sample preparation protocol was 5 times and showed similar results. c Left: Typical field of view negatively stained TEM image of polymerized filaments. Right: Typical field of view TIRF image of polymerized filaments with piston objects trapped inside. The filaments are labeled with Cyanine-5 dyes (10 per barrel monomer), the piston carries 8 Cyanine-3 dyes, image is merged from the two fluorescence channels. Scale bars: 1 μm. The total number of conducted TEM analyses of samples prepared following the same protocol as illustrated in the transport system sample preparation protocol exceeded 10 times and showed similar results. d Exemplary sequence of single frames taken from a TIRF movie reflecting movement of a piston along a filament. Bottom: Standard deviation from the mean image for the entire movie (6000 frames, frame rate = 10/s), illustrating that the piston has traveled across the entire length of this ~3 μm long filament. Scale bar: 1 μm. Source data are provided as a Source Data file.

