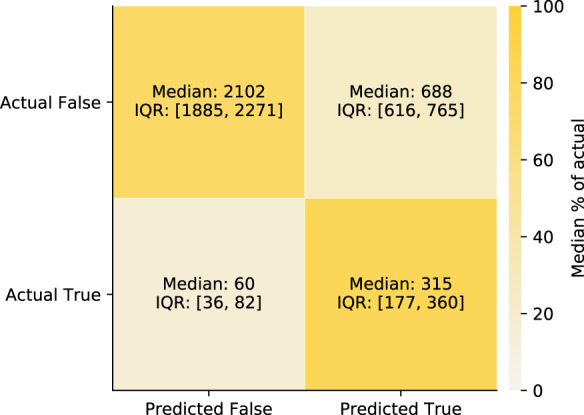
Fig. 5. Confusion matrix for the reduced feature sets across splits.

Confusion matrix for the predictions of the test sets based on the optimal decision threshold based on the Youden’s J statistic. True refers to entering critical state, and False refers to not entering critical state. The shades of the confusion matrix correspond to the median percentage of the actual labels (i.e., shade of the top left cell and the bottom right cell represent the median specificity and the median sensitivity, respectively).
