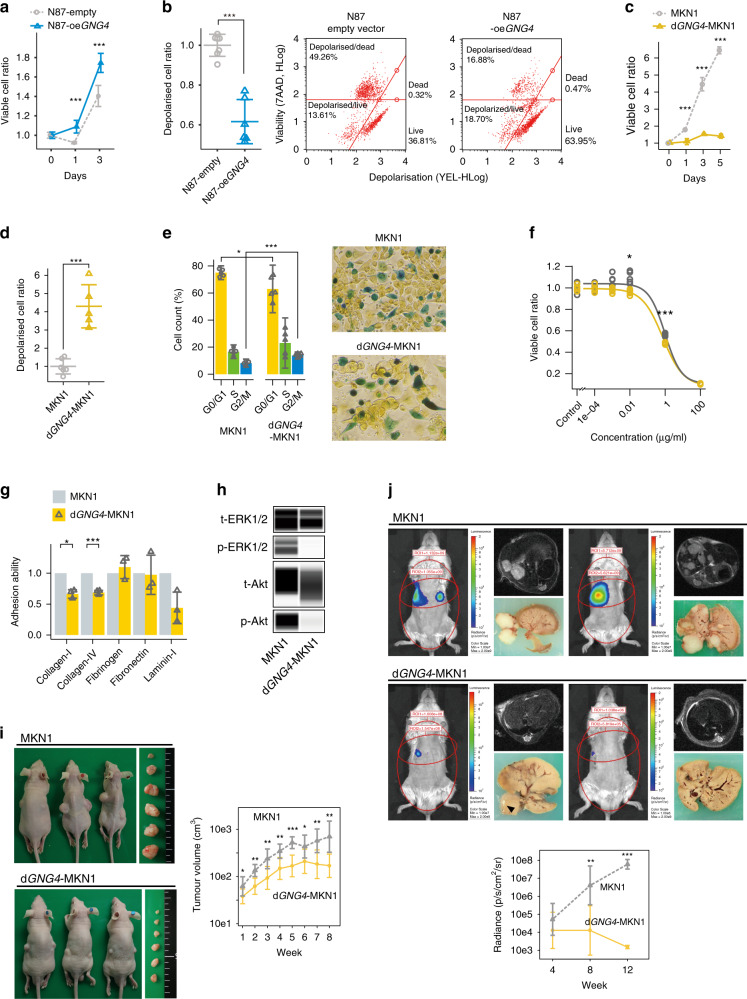
Fig. 3. GNG4 promotes malignant phenotypes of gastric cancer cell lines; in vitro and in vivo assays with transient overexpression of GNG4 (oeGNG4) and stable knockout of GNG4 (dGNG4).
Cell proliferation assay (a) and mitochondrial membrane depolarisation (MitoPotential) assay (b) between N87 cells transfected with an empty vector (N87-empty) and N87-oeGNG4 cells. Cell proliferation assay (c) and MitoPotential assay (d) between parental MKN1 and dGNG4-MKN1 cells. Cell cycle assay comparing MKN1 and dGNG4-MKN1 cells using colorimetric detection of the cell cycle phase (e). Drug-sensitivity assay to 5FU (f) and cell adhesion assay to solid matrices (g) comparing MKN1 and dGNG4-MKN1 cells. Capillary-based immunoassays of phospho-extracellular signal-regulated kinase 1/2 (ERK1/2) (Thr202/Tyr204), total ERK1/2, phospho-Akt (Ser473) and total Akt comparing MKN1 and dGNG4-MKN1 cells (h). p- indicates phosphorylated; t-, total. Mouse subcutaneous xenograft model (i) and liver metastatic model (j) comparing MKN1 and dGNG4-MKN1 cells. Tumour volume was evaluated with an in vivo spectrum imaging system (IVIS) at 4, 8 and 12 weeks after implantation (plotted chronologically in the lower panel) and by MRI at 12 weeks after implantation. Circles on the mice indicate regions of interest. *P < 0.05, **P < 0.01, ***P < 0.001.

