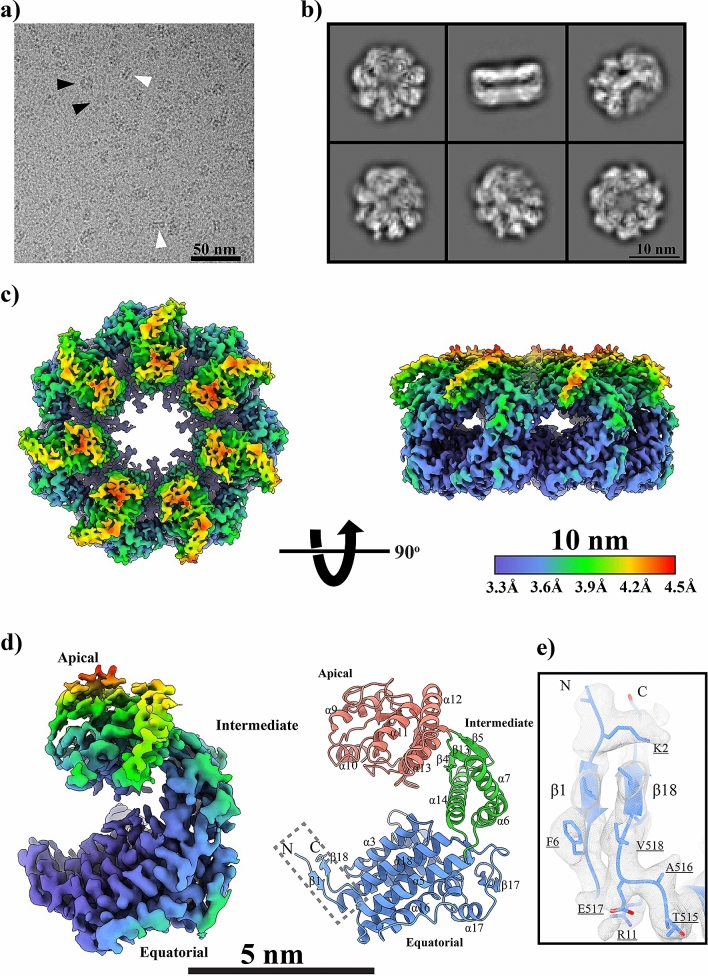
Figure 2.
Cryo-EM analysis of mHsp60. (a) A representative cryo-EM micrograph. Side and tilt views are highlighted by white and black arrowheads. (b) Representative reference-free 2D class averages images. (c) Cryo-EM reconstruction of the mHsp60 heptamer colored by local resolution. (d) A mHsp60 subunit displayed in cryo-EM reconstruction with local resolution and in ribbon representation. Ribbon color scheme, blue, green and red for the equatorial, intermediate and apical domains, is the same as Fig. 3C. (e) The EM density at the region involved in the inter-subunit interaction.

