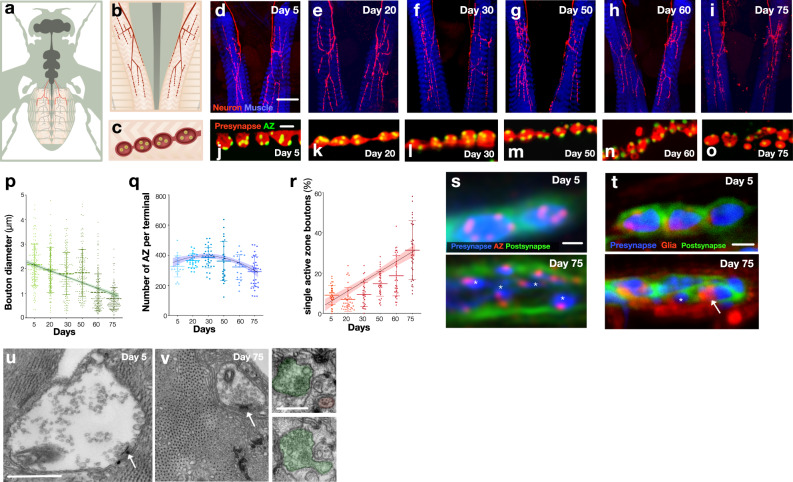
Fig. 1. Drosophila synaptic terminal structures fragment, neurotransmission declines and motor behaviour is diminished during ageing.
Schematic of adult Drosophila HB9 labelled motor neurons (a, red) which innervate a subset of ventral and dorsal muscles of the anterior abdomen including A2 mvim (b) producing terminal bouton varicosities (c) with multiple active zones of synaptic vesicle release (yellow). d–i Representative images of progressive degeneration of HB9 abdominal synaptic terminals (red, GFP) innervating A2 abdominal muscles (blue, phalloidin) from 5 days after eclosion to 75 days. Magnification is identical for all images. j–o Representative images of progressive fragmentation of synaptic boutons (red, GFP) through reduction in size and number of active zones (green, Brp) per bouton during ageing. Magnification is identical for all images. p Quantification of diminishment of bouton diameters during ageing. q Quantification of the number of active zones during ageing. r Quantification of bouton fragmentation during ageing as measured by the percentage of boutons with only a single active zone. s Representative images of presynaptic boutons (blue, mCherry) at day 5 (upper panel) and day 75 (lower panel). Boutons are labeled with the active zone marker Brp (red) and the postsynaptic membrane marker Dlg (green). Asterisks indicate fragmentation of presynaptic terminal at day 75. Magnification is identical for both images. t Example of postsynaptic membrane (Green, Dlg) becoming opposed by peripheral glia (Red, mCherry) [indicated by arrow] as presynaptic terminals fragment (indicated by asterisk) (Blue, GFP) in 75-day old animals (lower panel), which is not found in 5-day-old young animals (upper panel). Magnification is identical for both images. n = 4 biologically independent preparations. u, v Representative micrographs of bouton at day 5 and day 75, respectively. v (Right panels) serial micrograph shows an example of a fragmented bouton which is associated with other boutons by a thin process. Arrows indicate T-bars. n = 11 (u) and 5 (v) biologically independent preparations. One-way ANOVA, ***p < 0.001, R2 = 0.28, n = 150 boutons per timepoint (p), ***p < 0.001, R2 = 0.11, n ≥ 21presynaptic terminals per timepoint (q), ***p < 0.001, R2 = 0.48, n ≥ 27 presynaptic terminals per timepoint (r), Tukey’s multiple comparison tests were used to compare the mean of each timepoint with the mean of all other timepoints (ns = not significant, *p ≤ 0.033, **p ≤ 0.002, ***p ≤ 0.001). All statistical analysis details with a precise value of ‘n’ are reported in Supplementary Table 2 and in Source Data file. Scale bars, 40 μm (d–i), 2 μm (j–o, s, t), 500 nm (u, v), 250 nm (v, right panel). Data are represented as mean ± SD. n = biologically independent samples.

