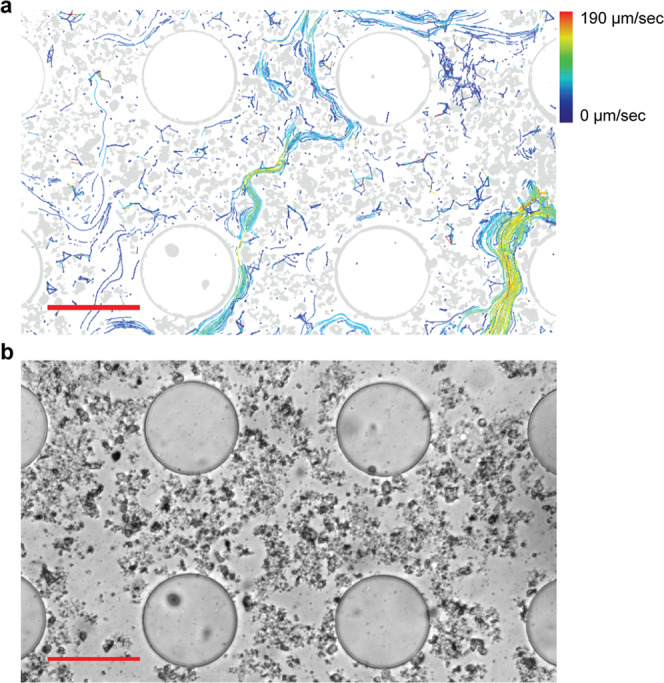
Fig. 5. Preferred water flow paths in the soil matrix within the chip, revealed by tracking of displaced particles.

a Threshold image and tracked particle visualization of a 45 s long real-time movie sequence (ImageJ plug-in TrackMate version 3.8.0.; Supplementary Movie 17). Colors of the lines following the tracked paths indicate the mean velocity of the particles. The large round structures are pillars of the chip, smaller particles are soil minerals that were dragged into the chip. The recorded water flow was caused by drying of the chip through the adjacent soil layer. b Original bright-field image (Supplementary Movie 18), recorded from an initially air-filled chip buried in soil of Expt. 1. Scale bars = 100 µm (a, b).
