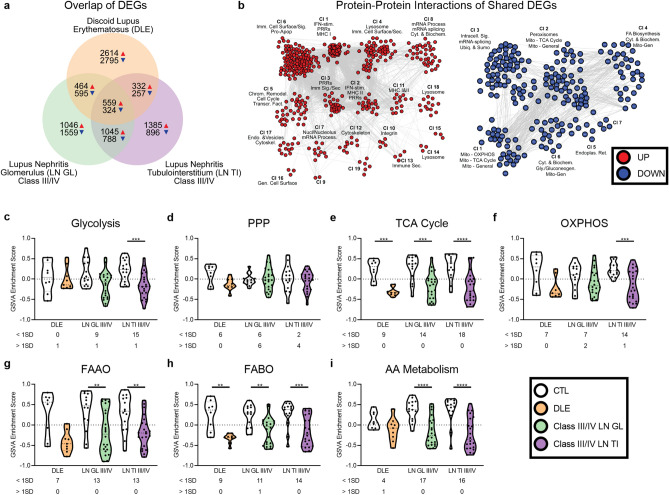
Figure 1.
Dysregulation of metabolic gene signatures is common among lupus-affected tissues. (a) Comparison of DEGs among DLE, class III/IV LN GL, and class III/IV LN TI. (b) MCODE protein–protein interactions of common UP and DOWN DEGs were generated with Cytoscape using the STRING and ClusterMaker2 plugins and annotated with BIG-C functional categories (odds ratio (OR) > 1, p < 0.05) in Adobe Illustrator. Overlap p-value was calculated using Fisher’s exact test. GSVA of signatures for (c) glycolysis, (d) the PPP, (e) the TCA cycle, (f) OXPHOS, (g) FAAO, (h) FABO, and (i) AA metabolism in lupus tissues and controls (CTLs). Each point represents an individual sample. Significant differences in enrichment of the metabolic signatures in each lupus tissue as compared to CTL was determined by Welch’s t-test with Bonferroni correction. Numbers below each tissue indicate the number of lupus patients with enrichment scores 1 SD less than (< 1SD) or greater than (> 1SD) the CTL mean. For all calculations, the following sample numbers were used: DLE [CTL (n = 8), DLE (n = 9)], LN GL [CTL (n = 14), Cl III/IV (n = 22)], and LN TI [CTL (n = 15), Cl III/IV (n = 22)]. **, p < 0.01; ***, p < 0.001; ****, p < 0.0001.

