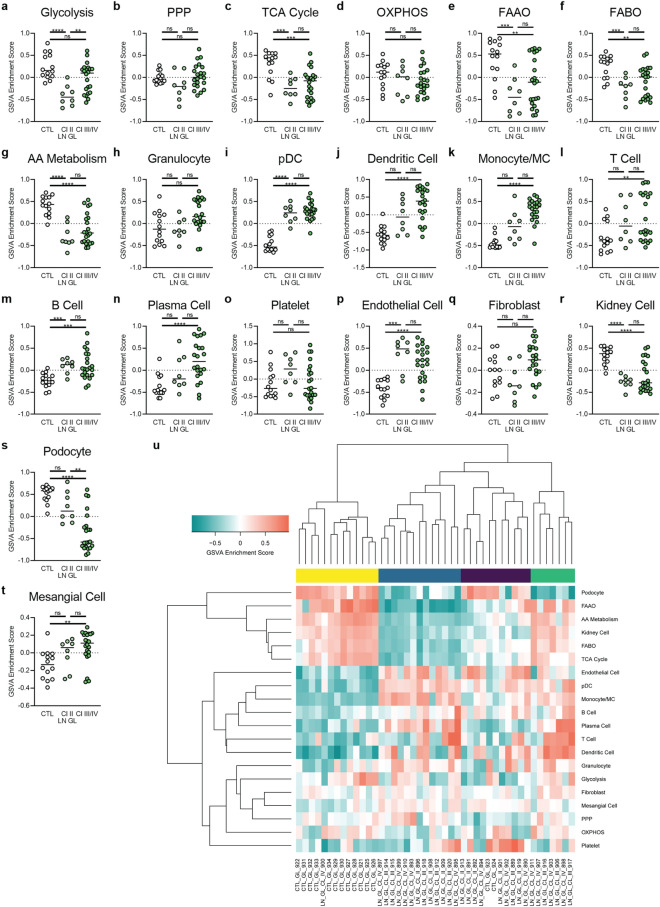
Figure 3.
Metabolic and cellular signature changes in class II LN GL are similar to those seen in class III/IV. GSVA of (a–g) metabolic pathway signatures and (h–t) cell signatures in all classes of LN GL. Each point represents an individual sample. Significant differences in enrichment of the metabolic signatures, immune cell signatures, or non-hematopoietic cell signatures between class II LN GL and CTL, class III/IV LN GL and CTL, and class II LN GL and class III/IV LN GL were performed by Welch’s t-test with Bonferroni correction. (u) Hierarchical clustering (k = 4) of all glomerular samples. For all calculations, the following sample numbers were used: LN GL [CTL (n = 14), Cl II (n = 8), Cl III/IV (n = 22)]. **, p < 0.01; ***, p < 0.001; ****, p < 0.0001.

